
- System requirements
- Profiler architecture
- Profiler installation
- Uninstall profiler
- Running the profiler
- Profiler activation
- Welcome screen
- Start profiling
- Profiling overhead
- Snapshots
- Solving performance problems
- CPU profiling
- Thread profiling
- Virtual threads support
- Object allocation profiling
- Memory profiling
- Monitor profiling
- Exception profiling
- Telemetry
- Probes: monitor events of various kinds
- Inspections: automatic recognition of typical problems
- Automatically trigger actions on event
- Automatic deobfuscation
- Summary
- Filters
- Profiler command line
- Export of profiling results to external formats
- Profiler Java API
- Profiler HTTP API
- Settings
- Troubleshooting and FAQ
Call tree - By thread
Call tree by thread shows an individual top-down call tree for each application thread.
Profiler shows call tree in CPU tracing, sampling and asynchronous sampling modes. For call counting mode the tree is not available, because call stacks are not collected.
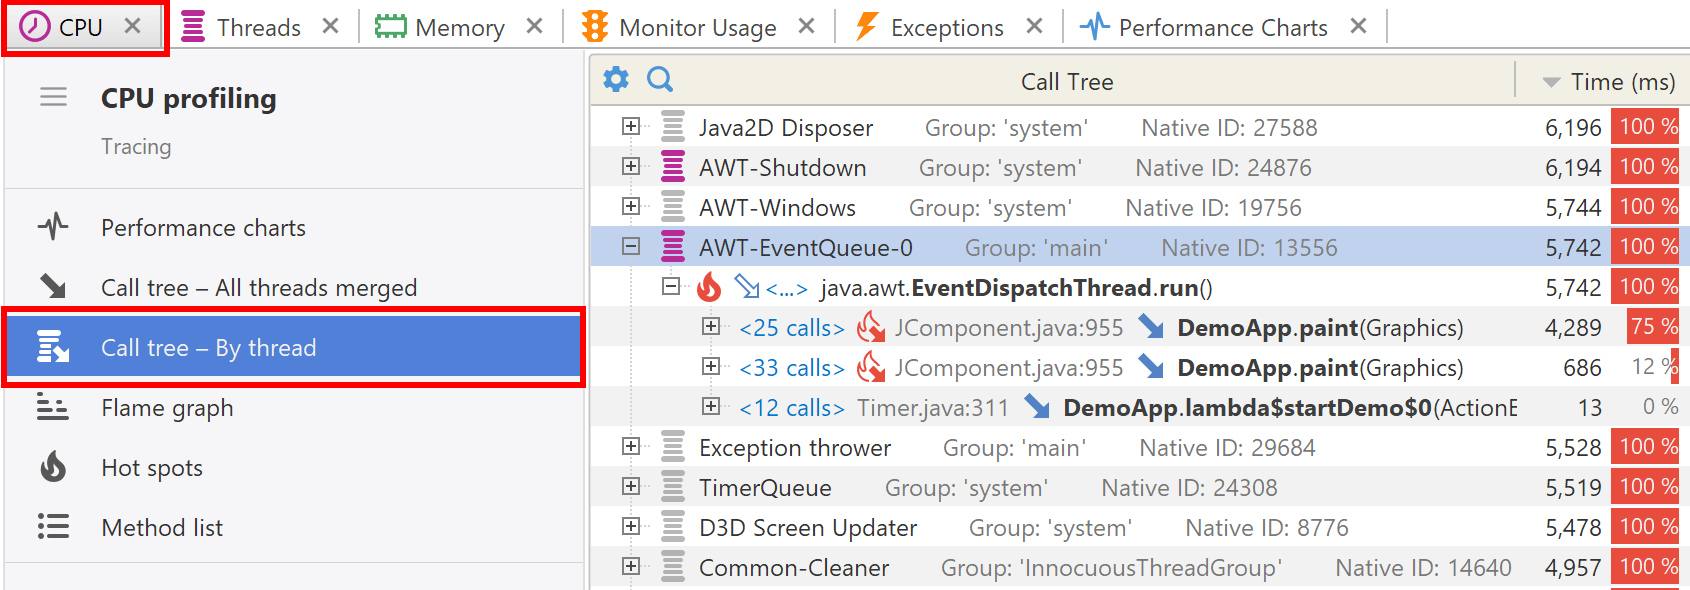
Filters
CPU call tree respects filter settings and collapses filtered methods.
Filtered methods are marked with non-filled arrow icon  ,
and there is <...> hyperlink that allows you to expand hidden content.
You can undo the expansion by using the Ctrl+Z shortcut or from popup menu.
,
and there is <...> hyperlink that allows you to expand hidden content.
You can undo the expansion by using the Ctrl+Z shortcut or from popup menu.
Actions
The following actions are available in main application menu and in the popup menu:
- CPU | Method Merged Callees (Ctrl+M) - shows the method's merged callees.
- CPU | Method Back Traces (Ctrl+Shift+M) - shows the method's back traces.
- Tools | Open in IDE (F7) - opens method declaration in IDE editor. See IDE integration.