- System requirements
- Profiler architecture
- Profiler installation
- Uninstall profiler
- Running the profiler
- Profiler activation
- Welcome screen
- Start profiling
- Profiling overhead
- Snapshots
- Solving performance problems
- CPU profiling
- Thread profiling
- Virtual threads support
- Object allocation profiling
- Memory profiling
- Monitor profiling
- Exception profiling
- Telemetry
- Probes: monitor events of various kinds
- Inspections: automatic recognition of typical problems
- Automatically trigger actions on event
- Automatic deobfuscation
- Summary
- Filters
- Profiler command line
- Export of profiling results to external formats
- Profiler Java API
- Profiler HTTP API
- Settings
- Troubleshooting and FAQ
Java EE profiling results
You can profile applications in high-level terms like SQL statements and URLs. For each Java EE call CPU time and invocation count are reported. These results are available in a captured snapshot and not available in "live" mode, when profiler is connected to the profiled application.
High-level results depends on corresponding built-in probes whose activity mode is Auto by default, which means they are active only while CPU profiling is running, in either CPU sampling or CPU tracing mode. If neither CPU tracing nor CPU sampling was running, Java EE profiling results are not available.
Note, that high-level profiling requires bytecode instrumentation and adds some overhead to the running application. For detailed information, see Profiling overhead: how to reduce or avoid.

Database
Database section shows requests and their invocation method back traces. You can see the requests as a plain list, or you can group them by type.
Supported database types:
- Cassandra
- HBase
- Java persistence (JPA): Hibernate, EclipseLink, OpenJPA, DataNucleus
- JDBC (SQL)
- MongoDB
JSPs and servlets
Shows list a of URLs that correspond to JSP and Servlet calls, and merged callees for all methods invoked with these URLs.
JNDI
Shows list of URLs that correspond to JNDI calls, and back traces for all methods invoked with these URLs.
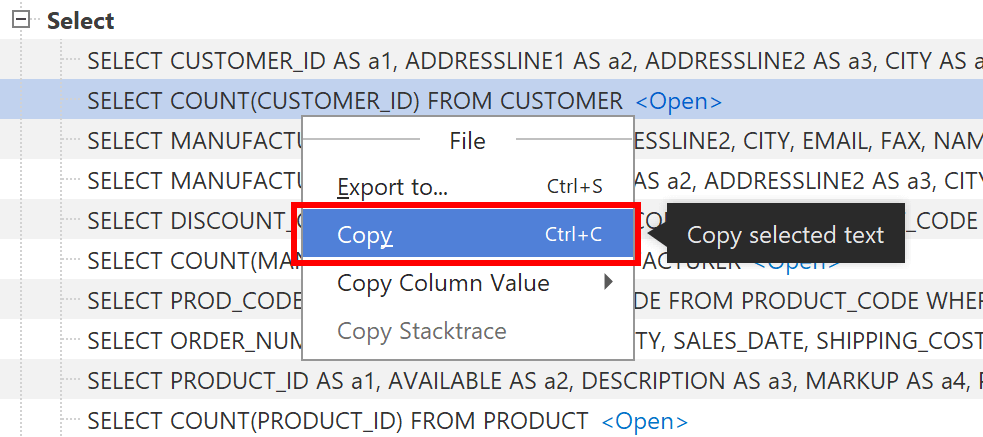
Actions
Lines can be copied by using File | Copy (Ctrl+C):