- System requirements
- Profiler architecture
- Profiler installation
- Uninstall profiler
- Running the profiler
- Profiler activation
- Welcome screen
- Start profiling
- Profiling overhead
- Snapshots
- Solving performance problems
- CPU profiling
- Thread profiling
- Object allocation profiling
- Memory profiling
- Exception profiling
- Telemetry
- Probes: monitor higher level events
- Inspections: automatic recognition of typical problems
- Automatically trigger actions on event
- Automatic deobfuscation
- Summary, automatic deobfuscation
- Filters
- Profiler command line
- Command line tool to control profiling
- Export of profiling results to external formats
- Profiler .NET API
- Profiler HTTP API
- Settings
- Troubleshooting
Events in user interface
The probes and their results are shown in tab "Events".
The tab is available when the profiler is connected to profiled application, as well as browsing saved snapshot.
Some functionality is available for a saved snapshot only.
The view consists of two parts:
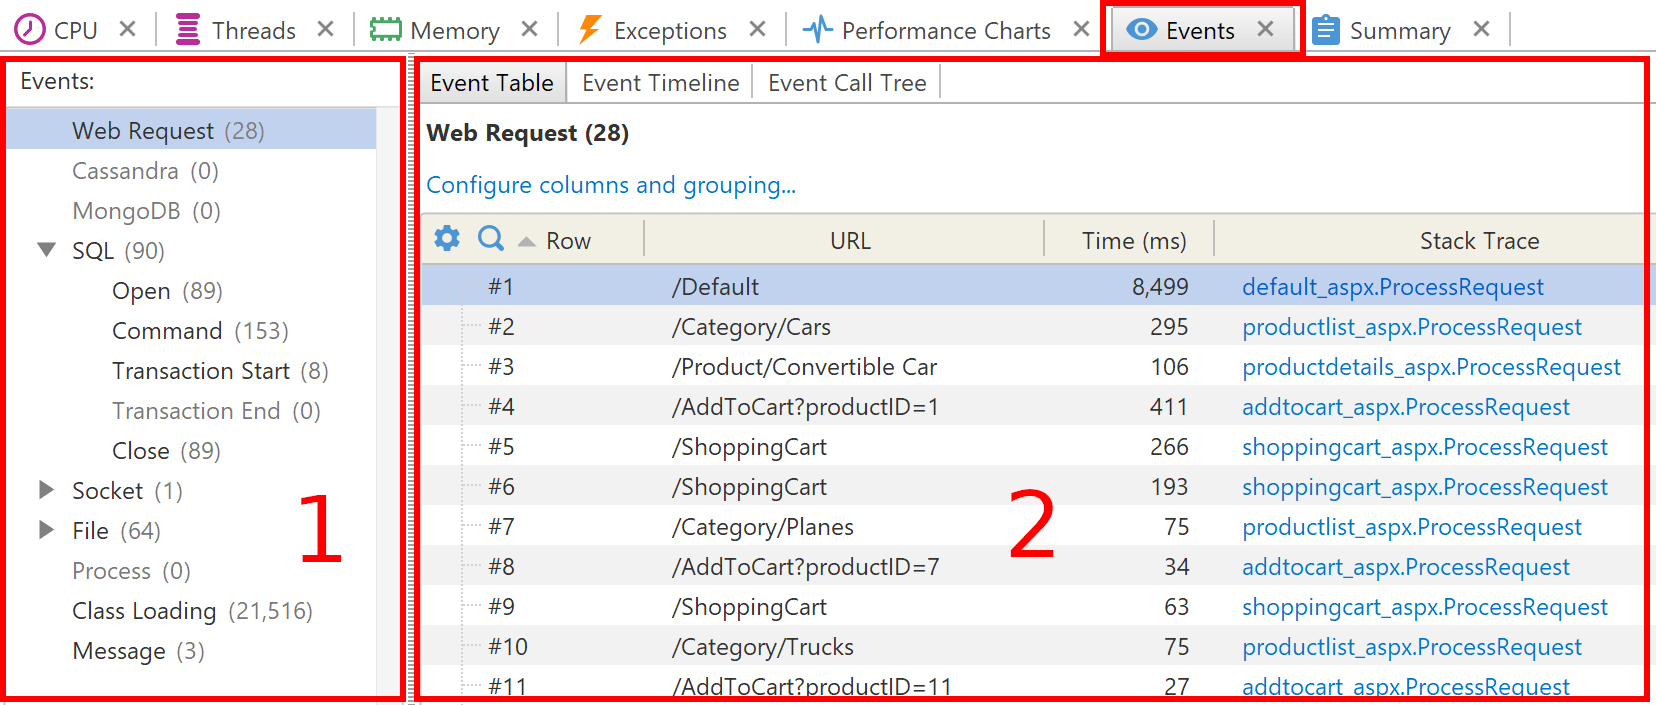
1. Table selector
Shows all available tables as a tree: dependent tables are show as nested nodes of their primary tables.
Selected table is shown in Event table (see below).
Also, the table selector controls events from which tables are shown in Event timeline and Event call tree views (see below) via checkboxes.
2. The views
- Event table shows events in the table, which is selected in the table selector (1).
- Event timeline shows an event sequence in a table form. Use the table selector (1) to specify which events to include.
- Event call tree shows events distributed by stack trace. Use the table selector (1) to specify which events to include.
Navigation between the views
To open selected event(s) in another view, use corresponding popup menu items. Read more...