- System requirements
- Profiler architecture
- Profiler installation
- Uninstall profiler
- Running the profiler
- Profiler activation
- Welcome screen
- Start profiling
- Profiling overhead
- Snapshots
- Solving performance problems
- CPU profiling
- Thread profiling
- Object allocation profiling
- Memory profiling
- Exception profiling
- Telemetry
- Probes: monitor higher level events
- Inspections: automatic recognition of typical problems
- Automatically trigger actions on event
- Automatic deobfuscation
- Summary, automatic deobfuscation
- Filters
- Profiler command line
- Command line tool to control profiling
- Export of profiling results to external formats
- Profiler .NET API
- Profiler HTTP API
- Settings
- Troubleshooting
Event stack traces
If event stack trace is available, top method is shown as a hyperlink. To see the stack trace, click the link or use a popup menu:
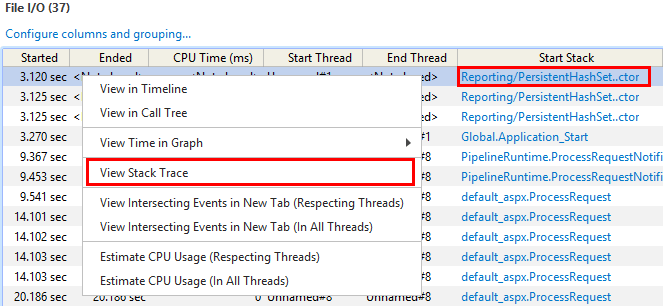
The stack is recorded when event starts and when event ends. You can also estimate CPU usage inside the event.
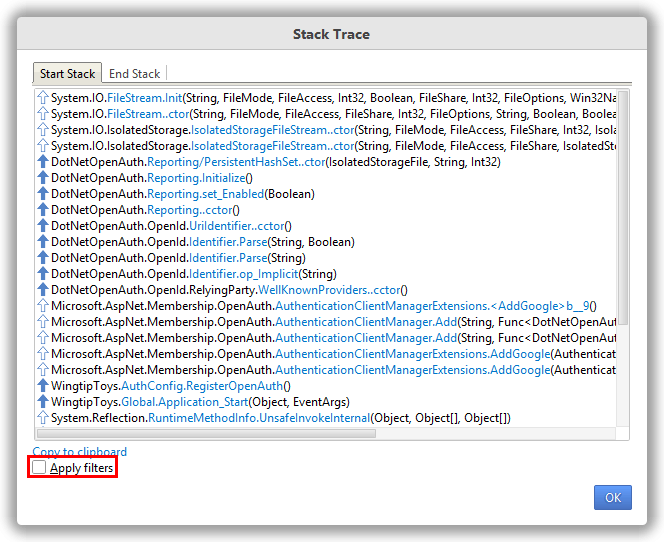
You can apply filters or see full stack trace: