- System requirements
- Profiler architecture
- Profiler installation
- Uninstall profiler
- Running the profiler
- Profiler activation
- Welcome screen
- Start profiling
- Profiling overhead
- Snapshots
- Solving performance problems
- CPU profiling
- Thread profiling
- Object allocation profiling
- Memory profiling
- Exception profiling
- Telemetry
- Probes: monitor higher level events
- Inspections: automatic recognition of typical problems
- Automatically trigger actions on event
- Automatic deobfuscation
- Summary, automatic deobfuscation
- Filters
- Profiler command line
- Command line tool to control profiling
- Export of profiling results to external formats
- Profiler .NET API
- Profiler HTTP API
- Settings
- Troubleshooting
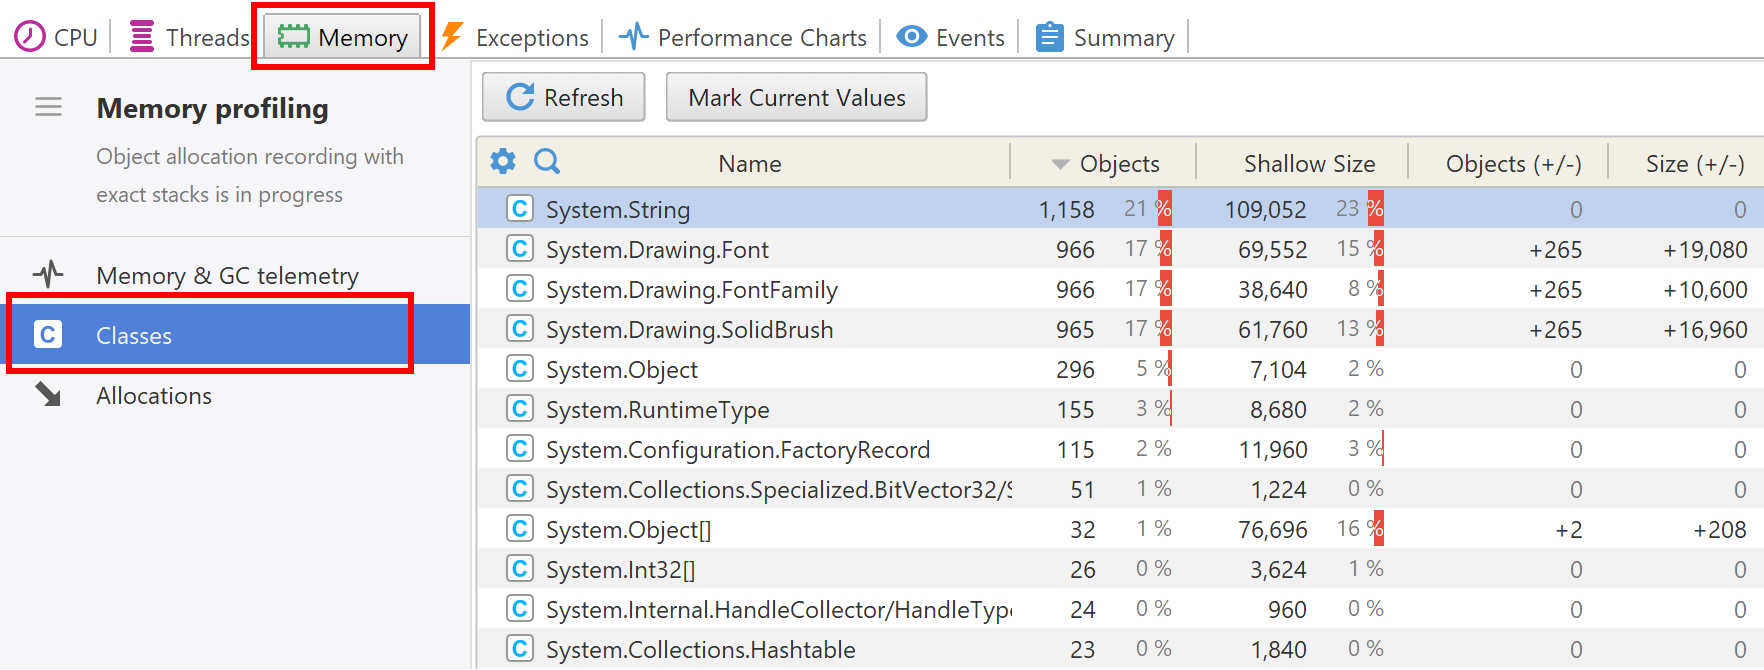
Class instance counts
Classes view shows object counts by class. This view is available when the profiler is connected to a running application, allowing to instantly learn object counts without capturing and opening a memory snapshot.
This view is also available in performance snapshots, but is not available in memory snapshots being superseded with objects view.
The presented information can be useful as an overview of memory consumed by the profiled application and also as a clue to detecting memory leaks. For details, see How to find out why application eats that much memory? and How to find memory leaks?