- System requirements
- Profiler architecture
- Profiler installation
- Uninstall profiler
- Running the profiler
- Profiler activation
- Welcome screen
- Start profiling
- Profiling overhead
- Snapshots
- Solving performance problems
- CPU profiling
- Thread profiling
- Object allocation profiling
- Memory profiling
- Exception profiling
- Telemetry
- Probes: monitor higher level events
- Inspections: automatic recognition of typical problems
- Automatically trigger actions on event
- Automatic deobfuscation
- Summary, automatic deobfuscation
- Filters
- Profiler command line
- Command line tool to control profiling
- Export of profiling results to external formats
- Profiler .NET API
- Profiler HTTP API
- Settings
- Troubleshooting
Memory telemetry
The YourKit .NET Profiler collects a wide range of .NET runtime telemetries to aid in the monitoring and optimization of .NET applications. Among these, memory telemetry provides detailed insights into the memory usage patterns of your application. This includes data on heap usage, garbage collector activity, and object allocation activity. By analyzing these charts, you can optimize your application's memory usage, reduce GC overhead, and improve overall performance.
- Memory usage charts
- Garbage collector activity charts
- Object allocation activity charts
- Working with telemetry charts
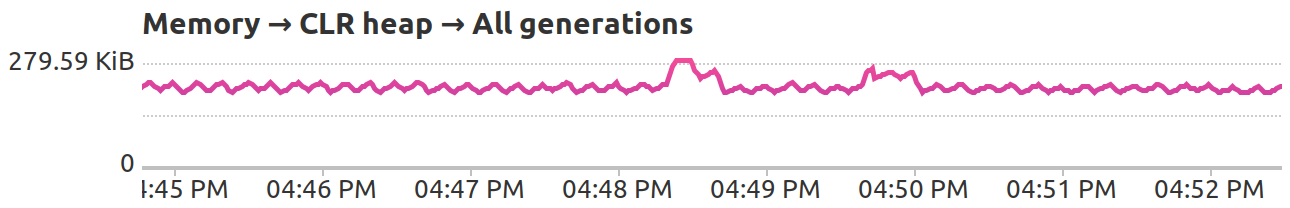
Memory usage charts
Memory usage charts help you visualize how your application consumes memory over time. These charts display the memory used by your application, including CLR heap and process memory. Heap memory is where .NET objects are allocated and deallocated, while process memory is used for other purposes, such as storing class metadata, and thread stacks.
Here's how you can use memory usage charts in .NET profiling:
1. Identify memory leaks: A memory leak occurs when an application continuously consumes more memory without releasing it. By inspecting memory usage charts, you can identify memory leaks by observing a steady increase in memory usage over time without a corresponding decrease.
2. Analyze memory usage patterns: Memory usage charts can reveal patterns in memory allocation and deallocation, helping you identify problematic areas in your code. For example, if your application's memory usage frequently spikes, it might indicate that certain parts of your code are creating large temporary objects.
3. Optimize memory consumption: By analyzing memory usage charts, you can identify which parts of your code use excessive memory and optimize them accordingly. This may involve modifying your data structures, implementing caching mechanisms, or using more memory-efficient algorithms.
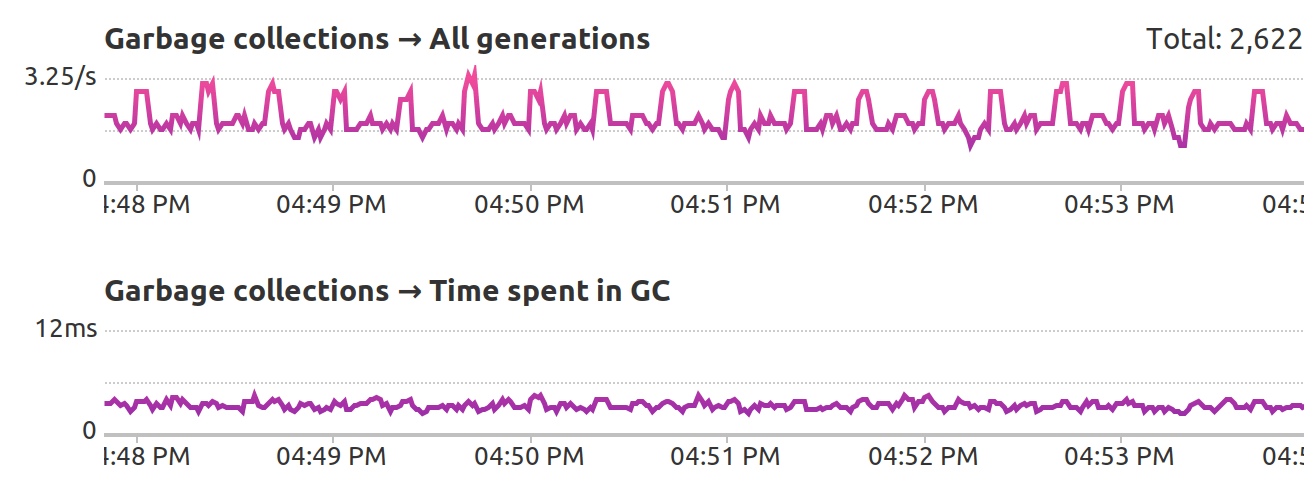
Garbage collector activity charts
Garbage collector (GC) activity charts display the frequency and duration of garbage collection events in your application. These charts help you understand how GC affects your application's performance.
Here's how you can use GC activity charts in .NET memory profiling:
1. Detect GC overhead: Frequent and long-lasting GC events can significantly impact your application's performance. By analyzing GC activity charts, you can detect excessive GC overhead and take corrective actions.
2. Tune garbage collector settings: GC activity charts can help you identify the most suitable garbage collector and its configuration for your application. .NET provides several garbage collectors, such as the Workstation GC and Server GC. By analyzing the GC activity chart, you can choose the most appropriate GC for your application and adjust its configuration parameters accordingly.
3. Identify potential memory leaks: Memory leaks can be detected by observing the heap memory before and after a full GC event. If the heap memory remains high after a full GC, it may indicate a memory leak. By comparing memory usage charts and GC activity charts, you can identify potential memory leaks.
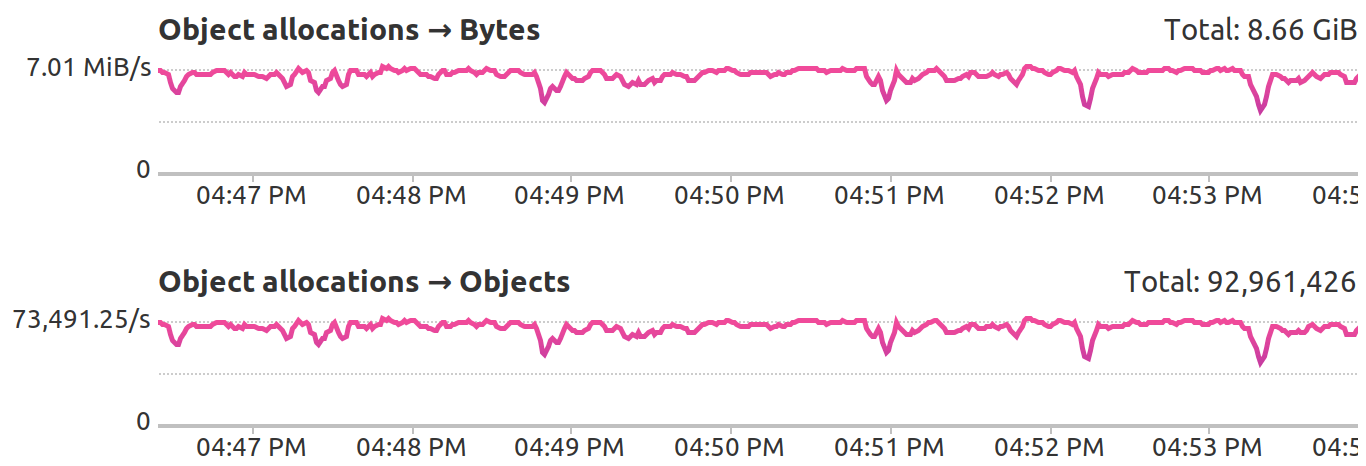
Object allocation activity charts
Memory allocation is a crucial aspect of any .NET application. It directly impacts the application's performance and efficiency. YourKit .NET Profiler provides memory allocation activity charts to monitor memory usage and identify bottlenecks. These charts display real-time data about the number of objects allocated per second and the amount of memory allocated per second.
Here are some ways memory allocation activity charts can be used in .NET profiling:
1. Detecting excessive memory allocation: Look for spikes in memory allocation. High-frequency allocation of large objects can trigger frequent garbage collection, affecting application performance. Analyze the code responsible for these spikes and consider optimizing or refactoring it.
2. Optimizing garbage collection pauses: Examine the memory allocation charts along with GC activity charts. Frequent and prolonged garbage collection can affect application performance. If there's a direct correlation between memory allocation spikes and GC activity, consider optimizing the memory allocation patterns to reduce GC pressure.
3. .NET options tuning: Adjust .NET GC settings to improve application performance.
4. Validating optimization efforts: Compare the memory allocation activity charts before and after optimization. Verify that the optimizations have reduced memory allocation, improved performance, or resolved any identified issues.
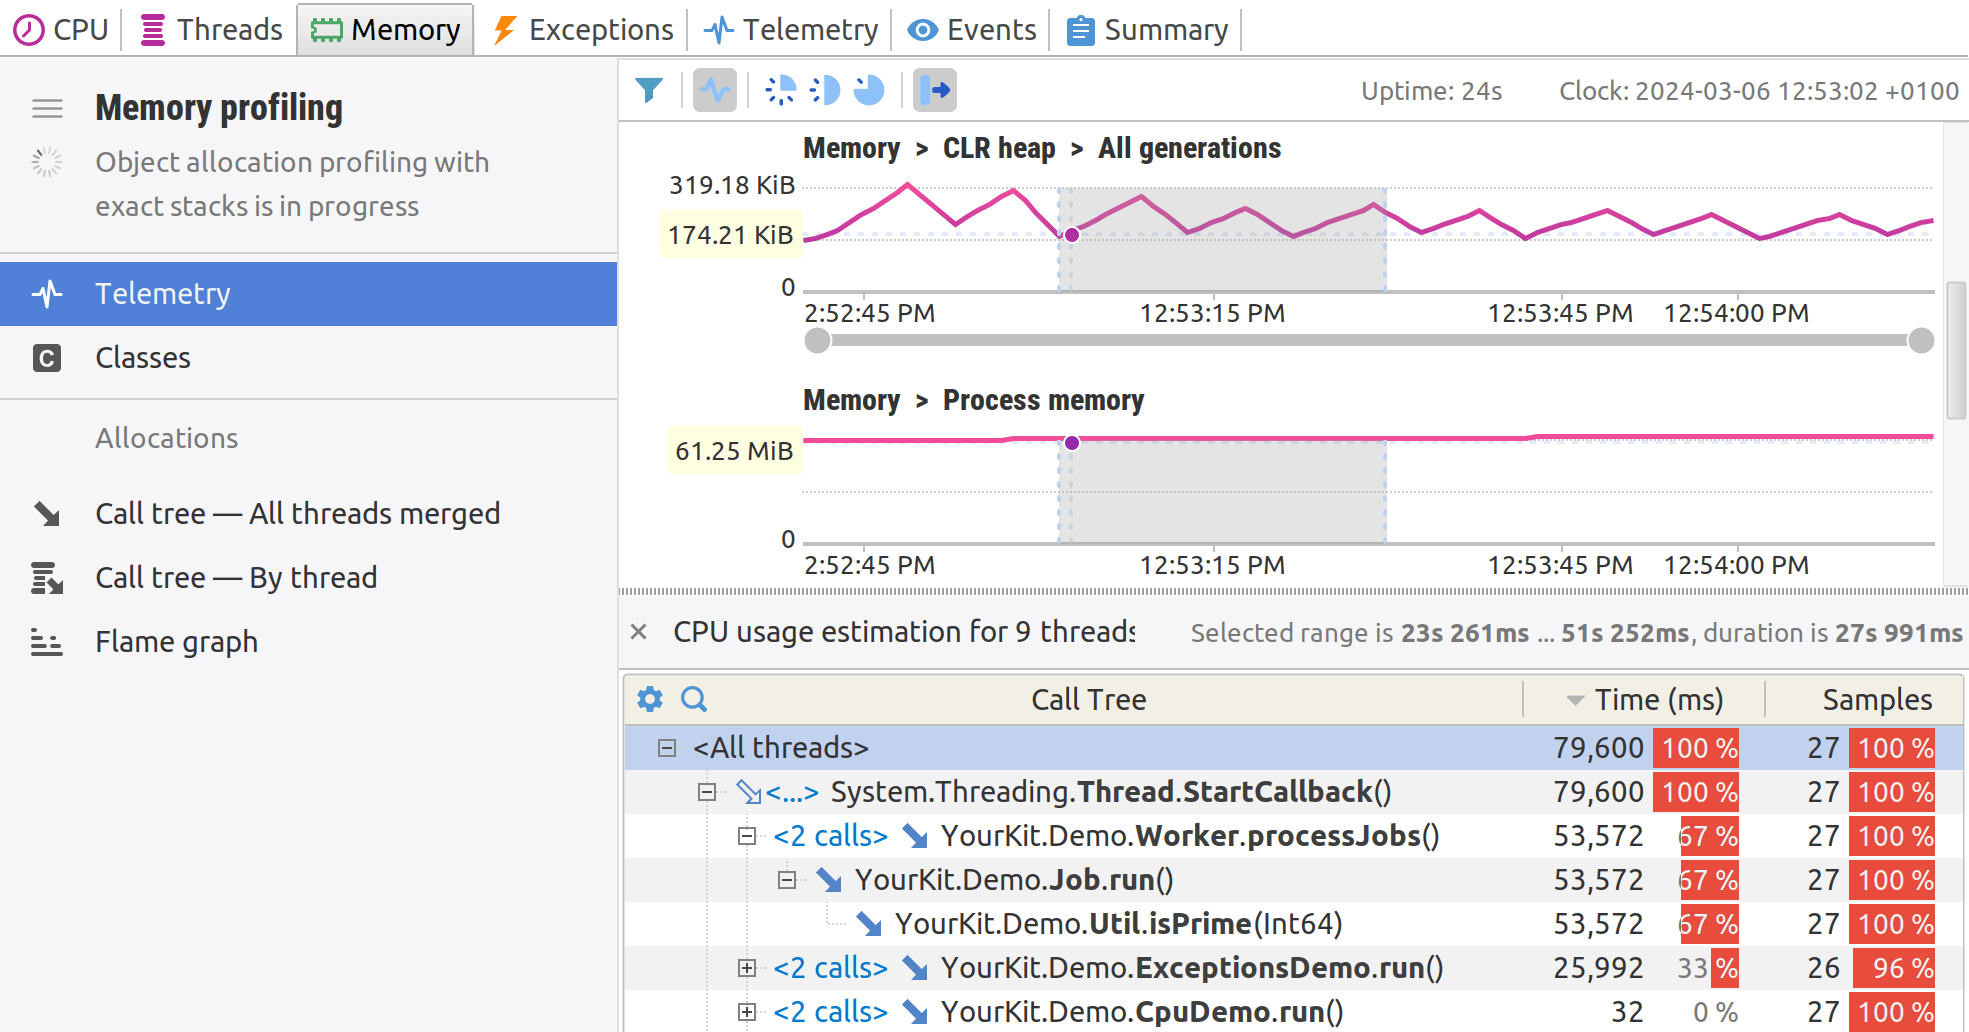
Working with telemetry charts
Clicking on chart: Clicking on a chart reveals the call stacks of the .NET threads running at that specific moment, providing a snapshot of the application's state.
Selecting the time interval: Analyzing performance over a time span is equally straightforward. By selecting a range within the telemetry data, profiler builds an estimated call tree and computes the CPU usage for that interval. This can be invaluable for pinpointing performance bottlenecks or understanding the behavior of the application during periods of high load.