- System requirements
- Profiler architecture
- Profiler installation
- Uninstall profiler
- Running the profiler
- Profiler activation
- Welcome screen
- Start profiling
- Profiling overhead
- Snapshots
- Solving performance problems
- CPU profiling
- Thread profiling
- Object allocation profiling
- Memory profiling
- Exception profiling
- Telemetry
- Probes: monitor higher level events
- Inspections: automatic recognition of typical problems
- Automatically trigger actions on event
- Automatic deobfuscation
- Summary, automatic deobfuscation
- Filters
- Profiler command line
- Command line tool to control profiling
- Export of profiling results to external formats
- Profiler .NET API
- Profiler HTTP API
- Settings
- Troubleshooting
Group objects by application domain and assembly module
In the context of .NET, the terms domains and modules often refer to application domains and assembly modules, respectively. Each has a specific role in .NET application architecture and execution.
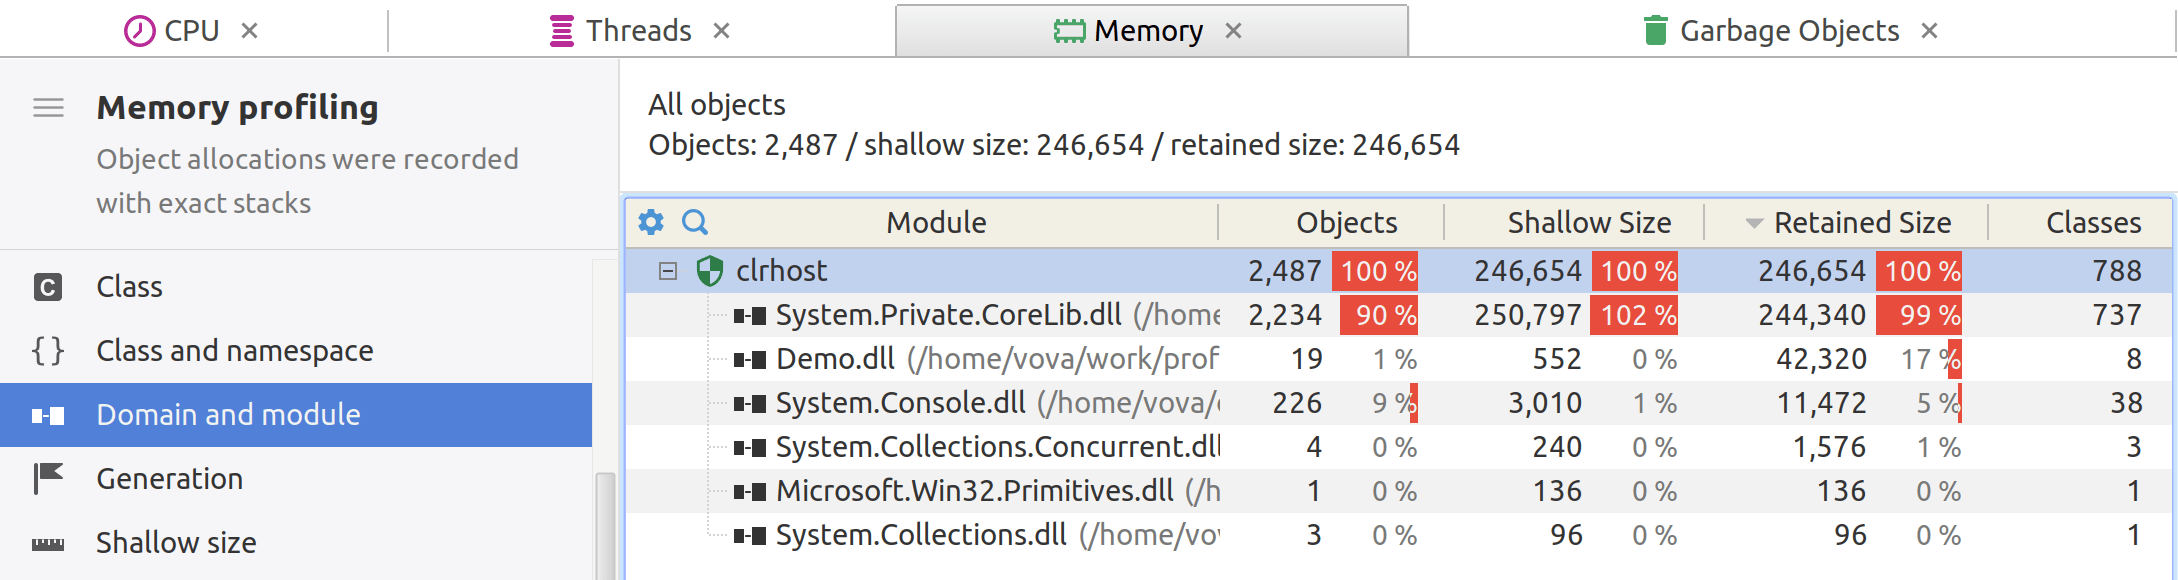
YourKit .NET Profiler allows you to group objects by their application domains and assembly modules, and evaluate how much memory they use:
Application domains
Application Domains (often called AppDomains) are a feature of .NET that allow you to isolate different applications running in the same process from each other. An AppDomain provides a boundary for security, versioning, and assembly loading.
AppDomains serve as isolated containers within a .NET process. By grouping objects and code by their AppDomain, you can accurately measure the resources consumed by different parts of your application or even different applications running in the same process. This allows you to pinpoint memory leaks, or other resource consumption issues at the AppDomain level.
Assembly modules
In .NET, an assembly is a unit of deployment and a logical unit of code. Assemblies are usually contained in EXE or DLL files. However, an assembly can be composed of one or more "modules," which are individual .NET binaries (DLL or NETMODULE files).
In large applications, assembly modules can help you break down your code into manageable pieces. Profiling by assembly modules lets you analyze performance at a more granular level. It enables you to identify which modules are the most resource-intensive, allowing for targeted optimization.