Changes in version 2021.11
- .NET 6 support
- IDE integration
- Networking
- User interface
- CPU profiling
- Memory profiling
- Events
- Miscellaneous
- Deprecations
.NET 6 support
- feature .NET 6 is supported.
IDE integration
- feature JetBrains Rider 2021.3 is supported.
- feature Visual Studio 2022 is supported.
- fix Profiling from IDE did not reuse profiler UI but every time launched a new UI instance.
Networking
- feature We have completely reimplemented transport layer of communication between profiler UI and agent. The communication is now implemented on top of HTTP, WebSocket and SSL which gives an ability to proxy traffic though the HTTP proxies like Apache and Nginx.
- feature Connection to the profiler agent is now possible through SOCKS v5 proxies.
- feature Communication between profile UI and profiler agent is now always encrypted by SSL. Profiler agent generates self-signed SSL certificates on the fly to achieve maximum security, when trusted SSL certificate is not available.
- feature Profiler agent exposes HTTP API. API is based on HTTP requests and JSON responses, so you can use any tool of your choice to send the requests, parse responses and automate profiling in your environment.
- feature Profiler agent has the options to comprehensively configure SSL encryption: chain of SSL certificates, secret key and password.
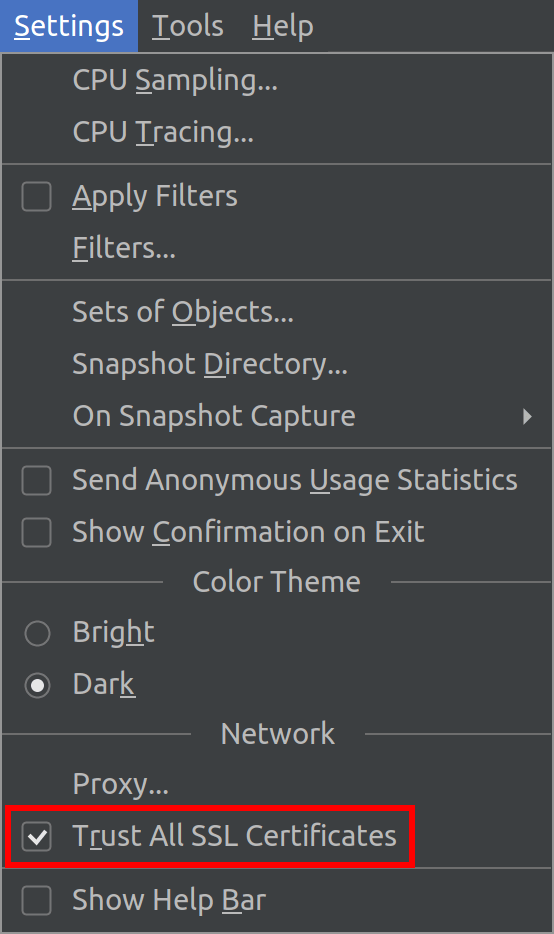
-
feature New option Trust All SSL certificates in Settings menu disables SSL certificate validation. It is crucial to disable the certificate validation when you run the profiler in a company network where the network traffic is analyzed by MITM proxy servers intercepting and substituting SSL certificates.
-
feature Profiler API class
YourKit.Profiler.Api.ControllerBuildergot an ability to connect to the agent behind the reverse HTTP proxies, by specifying reverse proxy path. -
feature
API of
YourKit.Profiler.Api.ControllerBuildernow allows to specify connection timeouts. - fix HTTP proxy authentication might not work in several circumstances.
- fix HTTP proxy detection did not work on Linux with GNOME desktop environment.
User interface
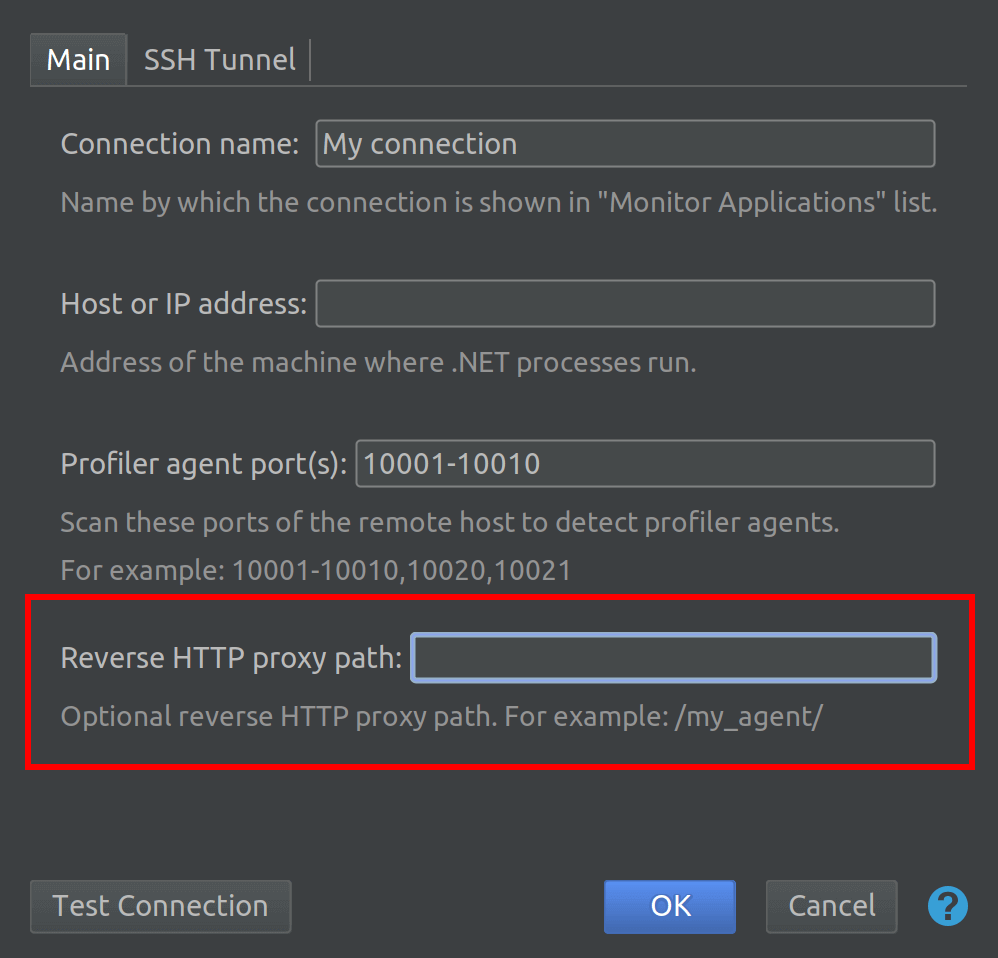
-
feature
Optional reverse HTTP proxy path can be configured when creating connection
to the remote agent.
- feature When transferring snapshots from the remote computer, it is now possible to use compression. Compression consumes additional CPU cycles, but might be beneficial on slow networks.
- improvement No matter if a method in a call tree is filtered or not, when it is expanded, the UI now always shows all sub-nodes with line numbers.
- improvement Remote snapshot transfer progress is now cancellable.
- fix Missing popup menu "Expand/Collapse" items.
- fix The profiler UI might freeze after the profiled application terminated.
- fix Internal error on attempt to open an invalid ZIP-ed (.zip) or GZIP-ed (.gz) snapshot.
- fix Depended view now keeps the sorted column when selection in the top table changes.
- fix Hyperlinks in trees might not work in several circumstances.
- fix Type to search feature did not scroll enough horizontally, so the matched text might be in invisible area.
- fix Toolbar buttons flickered just after connecting to the agent.
CPU profiling
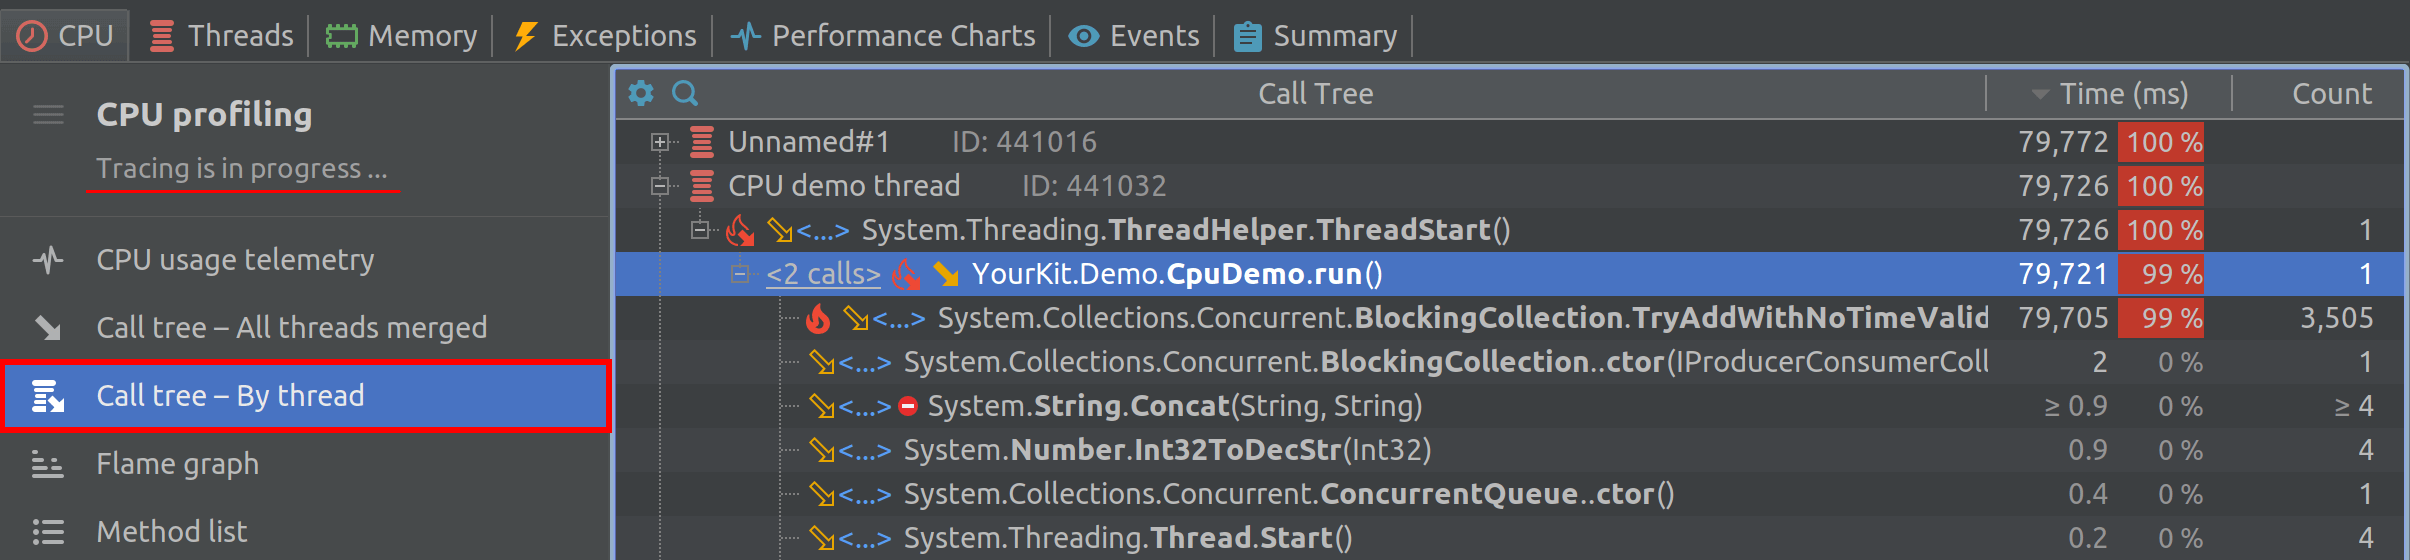
-
feature "CPU" tab: The live view now shows the call tree by thread in addition to the call tree with all threads merged.
Memory profiling
-
feature Object explorer: class-specific object presentation
for
System.Collections.Generic.PriorityQueueintroduced in .NET 6. -
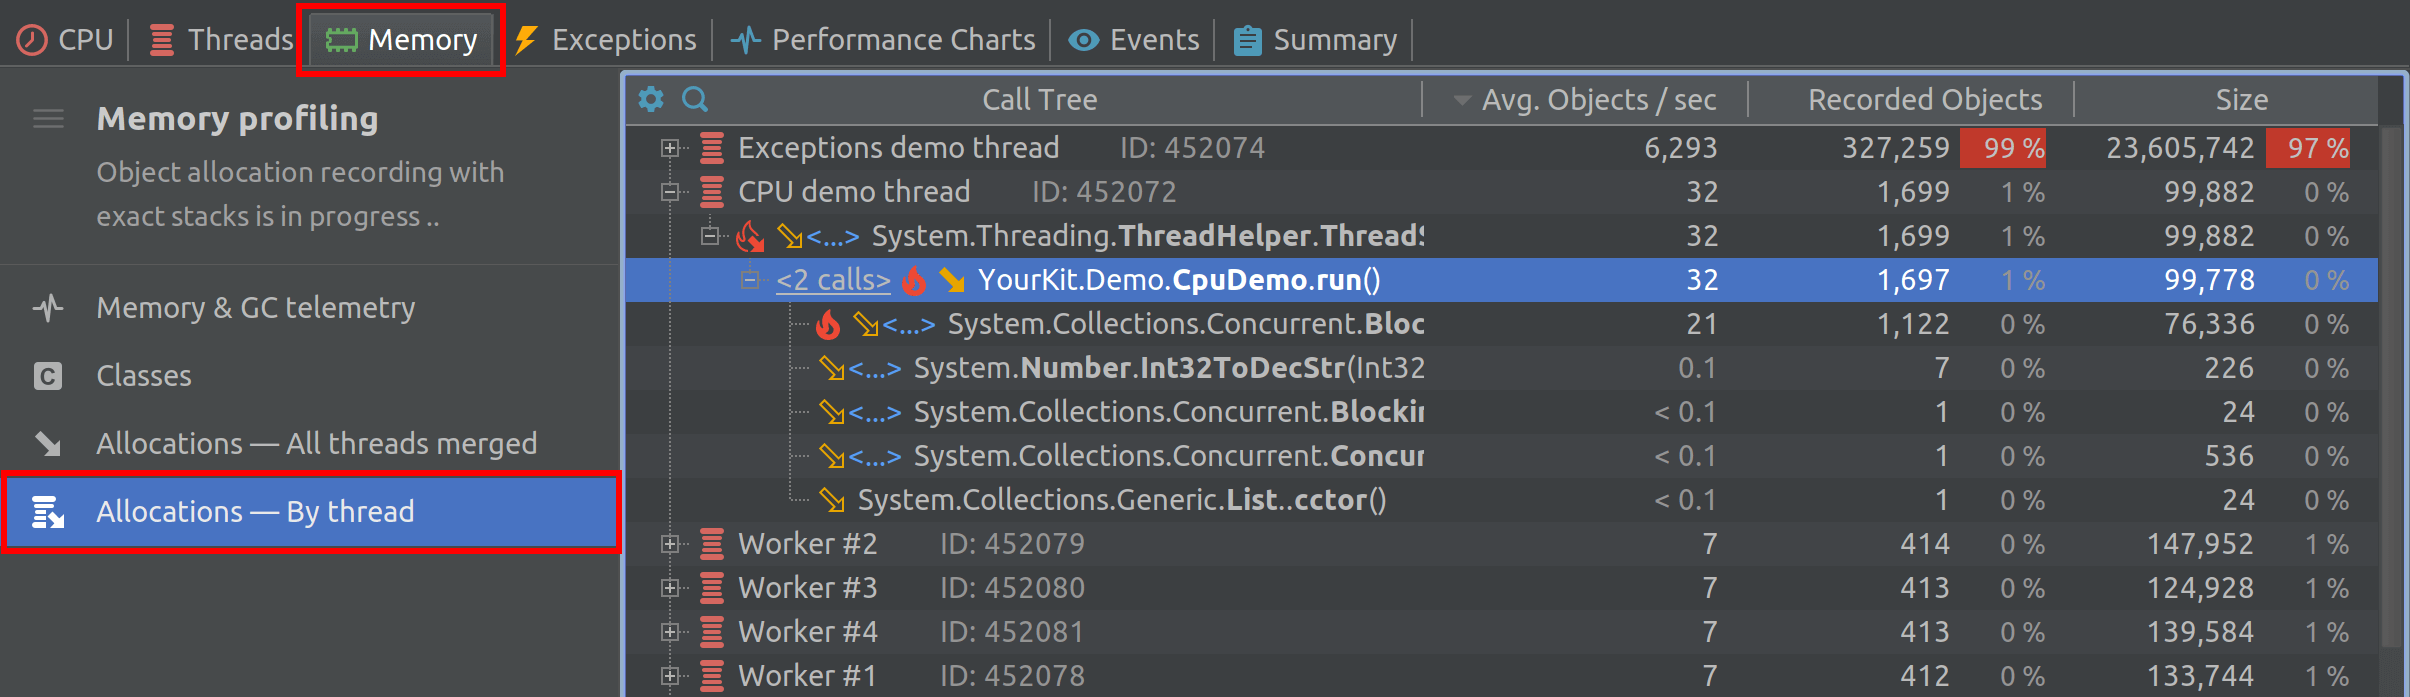
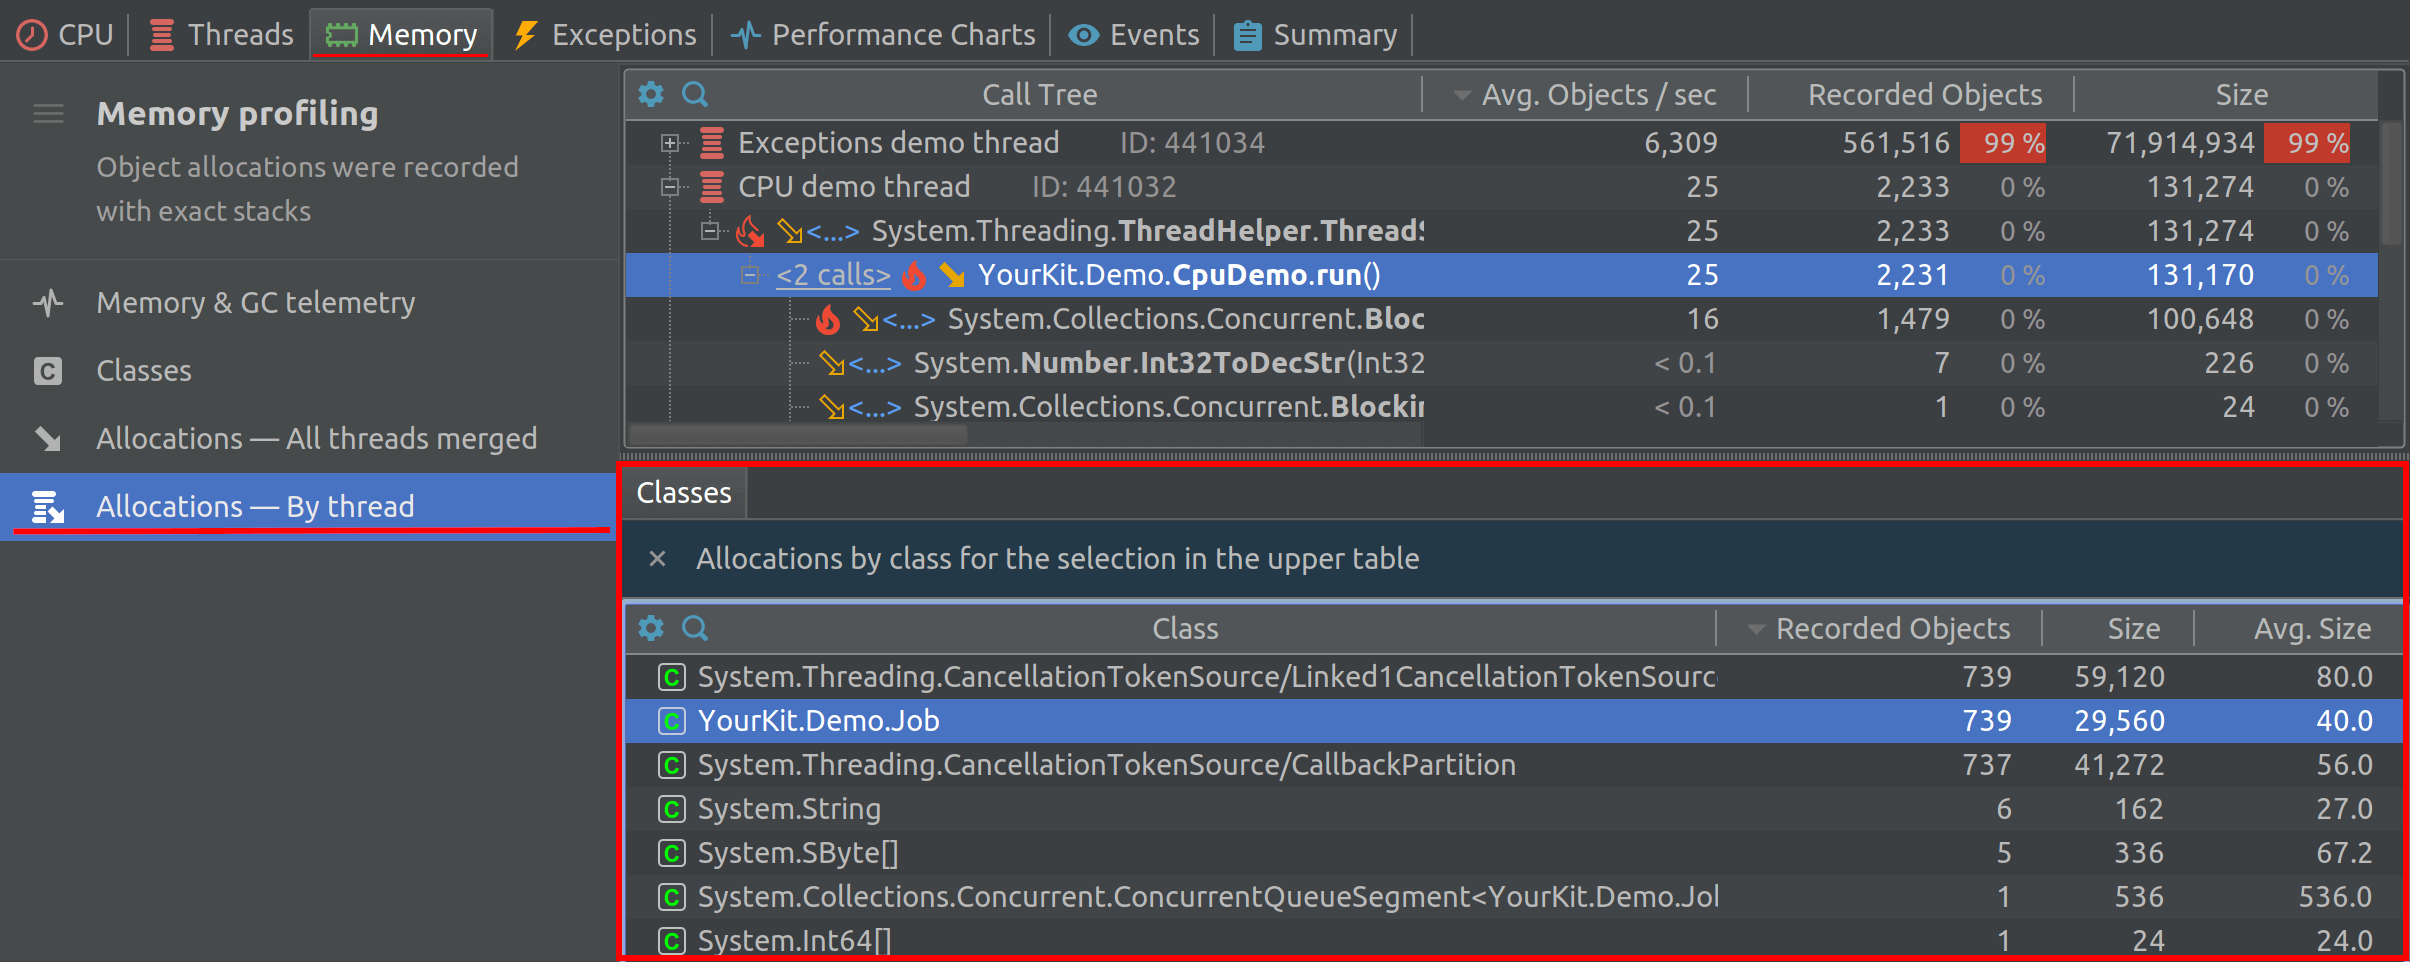
feature "Memory" tab: the Allocations section now shows the call tree by thread in addition to the call tree with all threads merged.
-
feature "Memory" tab: the Allocations section now shows the depended Classes view with per-class allocation statistics not only for a memory snapshot, but also for a live session and for a performance snapshot.
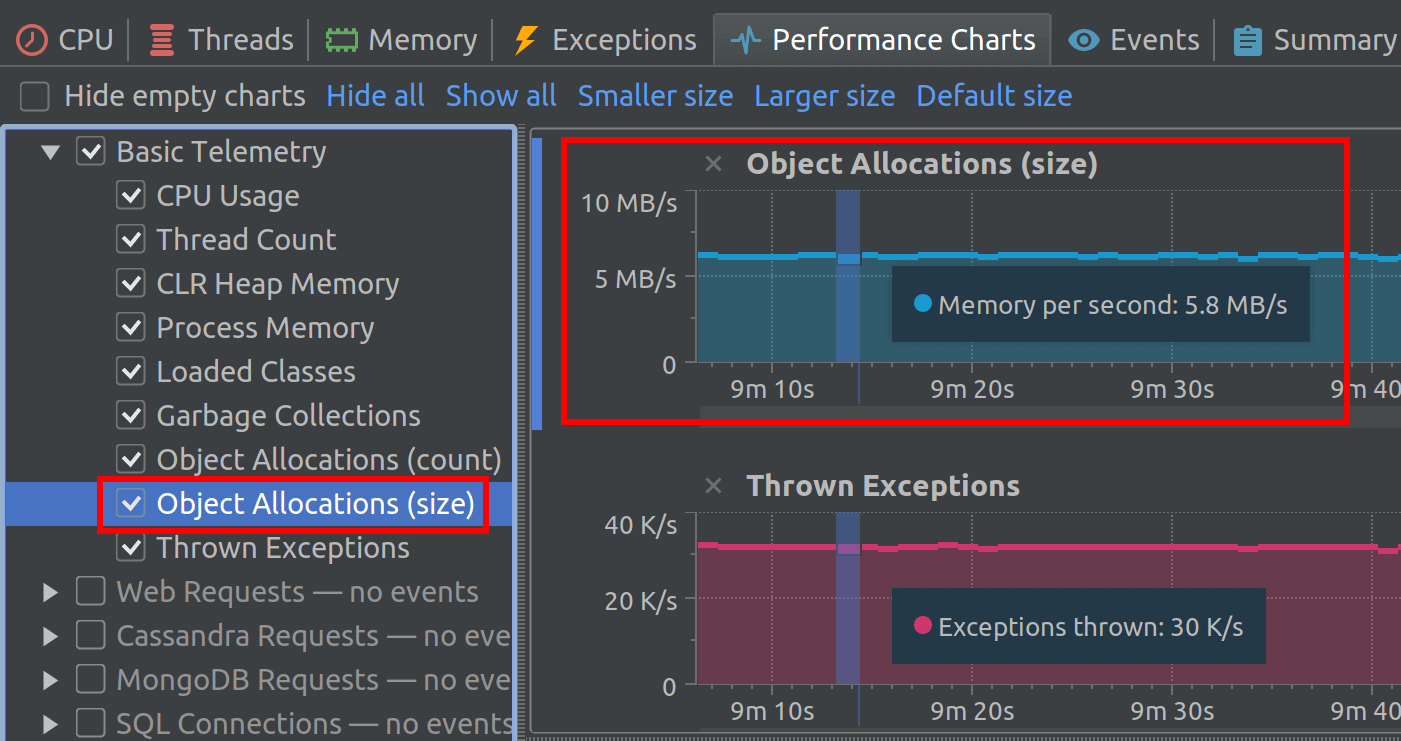
-
feature "Performance Charts": allocated object memory graph is show in addition to the allocated object count graph.
- fix Possible deadlock when profiling ASP.NET Core apps on Linux.
Events
- fix "Events" tab: focus might be lost when navigating the event table selector.
- improvement Tab Events by Table has been renamed to Event Table. The new name is shorter, cleaner and more consistent.
Miscellaneous
- feature Profiler agent writes information about client HTTP requests in the log file.
- improvement Agent startup option "listen" in the advanced mode accepts an IP address only.
- improvement For security, the profiler agent no longer opens socket on loopback if socket address is specified with the agent startup option "listen".
- fix Modification of triggers might not work on Linux under certain conditions.
- caveat Support of .NET Frameworks 2.0 - 3.5 that were deprecated in version 2020.11 has been removed. Now the minimal supported .NET Framework version is 4.0.
-
caveat
Profiler API:
YourKit.Profiler.Api.Controllerhas been refactored. New API breaks compatibility with the previous version, but source code could be trivially fixed to adopt the changes.
Deprecations
Deprecation means that we intend to remove the feature or capability from a future release of YourKit .NET Profiler. The feature or capability will continue to work and is fully supported until it is officially removed.
- Support of .NET Core 2.x is deprecated and scheduled for removal.