- System requirements
- Profiler architecture
- Profiler installation
- Uninstall profiler
- Running the profiler
- Profiler activation
- Welcome screen
- Start profiling
- Profiling overhead
- Snapshots
- Solving performance problems
- CPU profiling
- Thread profiling
- Telemetry
- Thread states
- Deadlocks
- Frozen threads
- Virtual threads support
- Object allocation profiling
- Memory profiling
- Monitor profiling
- Exception profiling
- Telemetry
- Probes: monitor events of various kinds
- Inspections: automatic recognition of typical problems
- Automatically trigger actions on event
- Automatic deobfuscation
- Summary
- Filters
- Profiler command line
- Export of profiling results to external formats
- Profiler Java API
- Profiler HTTP API
- Settings
- Troubleshooting and FAQ
Thread telemetry
Thread telemetry contains subset of telemetry charts, focusing specifically on thread-related performance metrics. It provides insights into key aspects of thread activity, such as the number of running threads, threads started per second, and other thread-specific statistics.
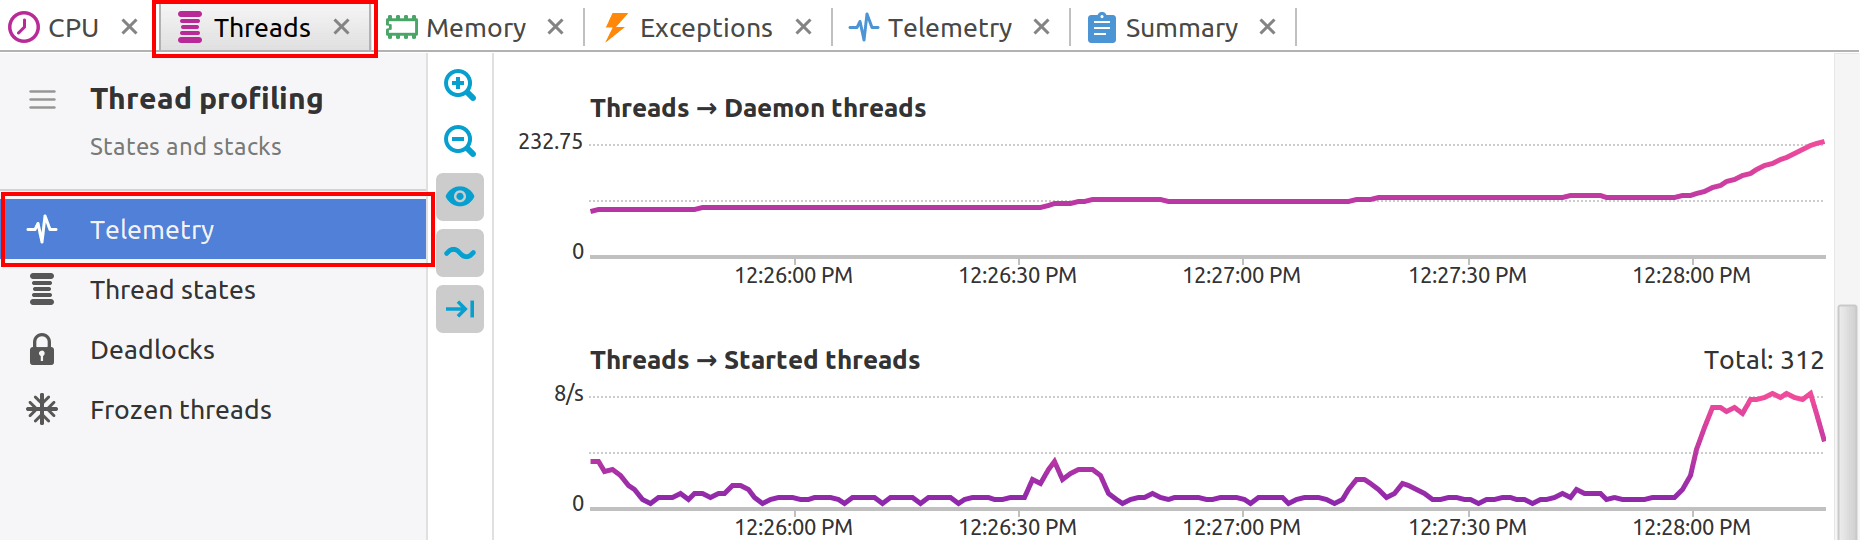
Toolbar
-

 :
Zoom in and out to quickly change the range of visible data.
:
Zoom in and out to quickly change the range of visible data.
-
 :
Show "empty" charts, i.e. the charts that have only zero values.
:
Show "empty" charts, i.e. the charts that have only zero values.
-
 :
Smooth out short-term fluctuations on graphs.
This is useful for visualizing of fast-changing data.
:
Smooth out short-term fluctuations on graphs.
This is useful for visualizing of fast-changing data.
-
 :
Control auto-scrolling behavior of telemetry charts.
When toggled, the graphs will be automatically scrolled to the right
when new data arrives.
:
Control auto-scrolling behavior of telemetry charts.
When toggled, the graphs will be automatically scrolled to the right
when new data arrives.