- System requirements
- Profiler architecture
- Profiler installation
- Uninstall profiler
- Running the profiler
- Profiler activation
- Welcome screen
- Start profiling
- Profiling overhead
- Snapshots
- Solving performance problems
- CPU profiling
- Thread profiling
- Telemetry
- Thread states
- Deadlocks
- Frozen threads
- Virtual threads support
- Object allocation profiling
- Memory profiling
- Monitor profiling
- Exception profiling
- Telemetry
- Probes: monitor events of various kinds
- Inspections: automatic recognition of typical problems
- Automatically trigger actions on event
- Automatic deobfuscation
- Summary
- Filters
- Profiler command line
- Export of profiling results to external formats
- Profiler Java API
- Profiler HTTP API
- Settings
- Troubleshooting and FAQ
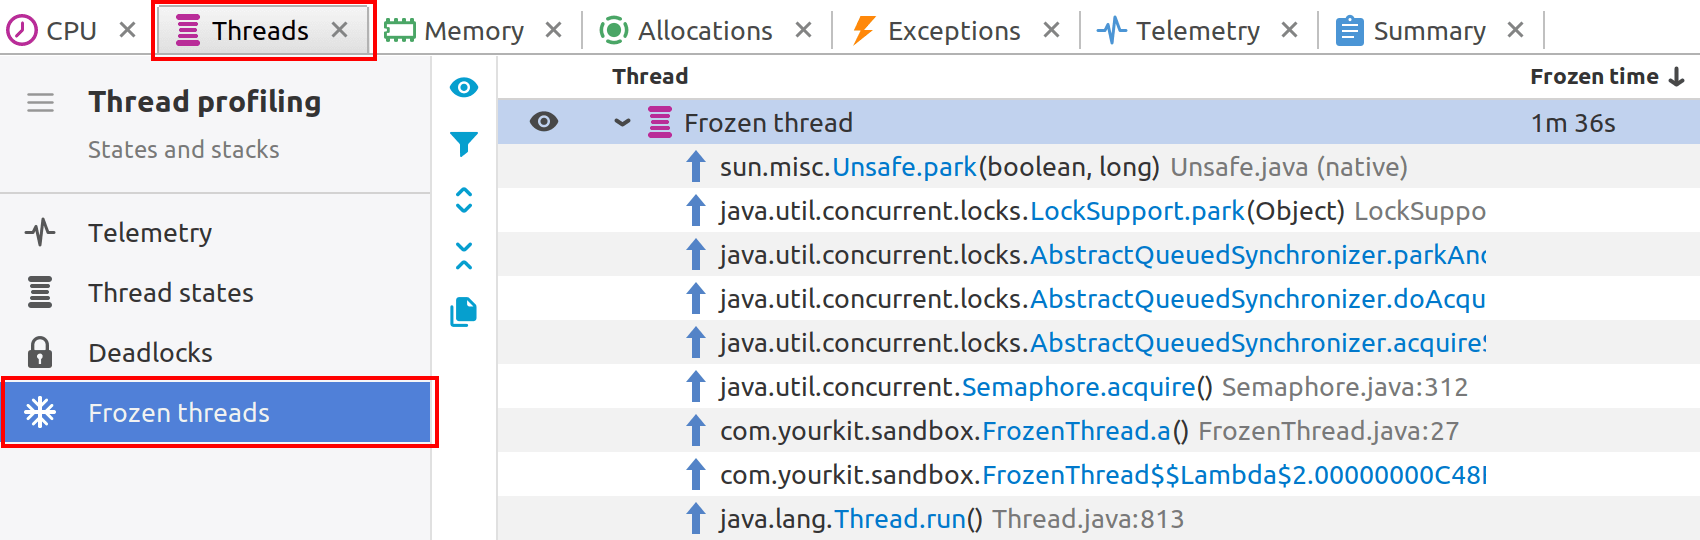
Frozen threads
Goals of frozen threads
Frozen threads view in the profiler helps identify threads that remain in the same state for an extended period, which may indicate potential deadlocks or hung threads. This capability complements the standard deadlocks detector by uncovering issues that might otherwise go unnoticed, such as deadlocks caused by JVM internal locks or native methods using low-level synchronization primitives.
Frozen thread detection depends on thread profiling with stack recording enabled. If thread profiling is stopped, the profiler will not be able to detect frozen threads. By continuously monitoring thread activity and stack changes, the profiler accurately identifies threads that appear stuck or unresponsive over time.
Frozen thread visibility
By default, well-known cases where threads remain in the same state, such as those waiting in a socket or JVM internal thread, are excluded from view to highlight potentially problematic threads.
You can customize visibility using
 and
and  buttons, filtering out threads performing long but legitimate operations or
revealing hidden threads for further evaluation.
This ensures you can focus on the most relevant threads during analysis.
buttons, filtering out threads performing long but legitimate operations or
revealing hidden threads for further evaluation.
This ensures you can focus on the most relevant threads during analysis.
Toolbar
-
 :
Show all frozen threads, including hidden ones.
:
Show all frozen threads, including hidden ones.
-
 :
Apply filters to this view.
:
Apply filters to this view.
-
 :
Expand all threads to show stacks.
:
Expand all threads to show stacks.
-
 :
Collapse all threads to hide stacks.
:
Collapse all threads to hide stacks.
-
 :
Copy all stack traces.
:
Copy all stack traces.