- System requirements
- Profiler architecture
- Profiler installation
- Uninstall profiler
- Running the profiler
- Profiler activation
- Welcome screen
- Start profiling
- Profiling overhead
- Snapshots
- Solving performance problems
- CPU profiling
- Thread profiling
- Telemetry
- Thread states
- Deadlocks
- Frozen threads
- Virtual threads support
- Object allocation profiling
- Memory profiling
- Monitor profiling
- Exception profiling
- Telemetry
- Probes: monitor events of various kinds
- Inspections: automatic recognition of typical problems
- Automatically trigger actions on event
- Automatic deobfuscation
- Summary
- Filters
- Profiler command line
- Export of profiling results to external formats
- Profiler Java API
- Profiler HTTP API
- Settings
- Troubleshooting and FAQ
Deadlocks
Goals of deadlocks detector
Deadlocks detector is designed to identify deadlocks among Java threads, providing critical insights into thread synchronization issues that can lead to application freezes or performance degradation. If a deadlock is detected within the JVM, a notification will be displayed to alert you immediately.
Agent startup options
Deadlocks detection is enabled by default and runs every 5 minutes.
You can adjust this behavior using the following startup options:
deadlocks=off to disable it,
and deadlocks_check_period
to set a custom check interval.
Deadlocks view
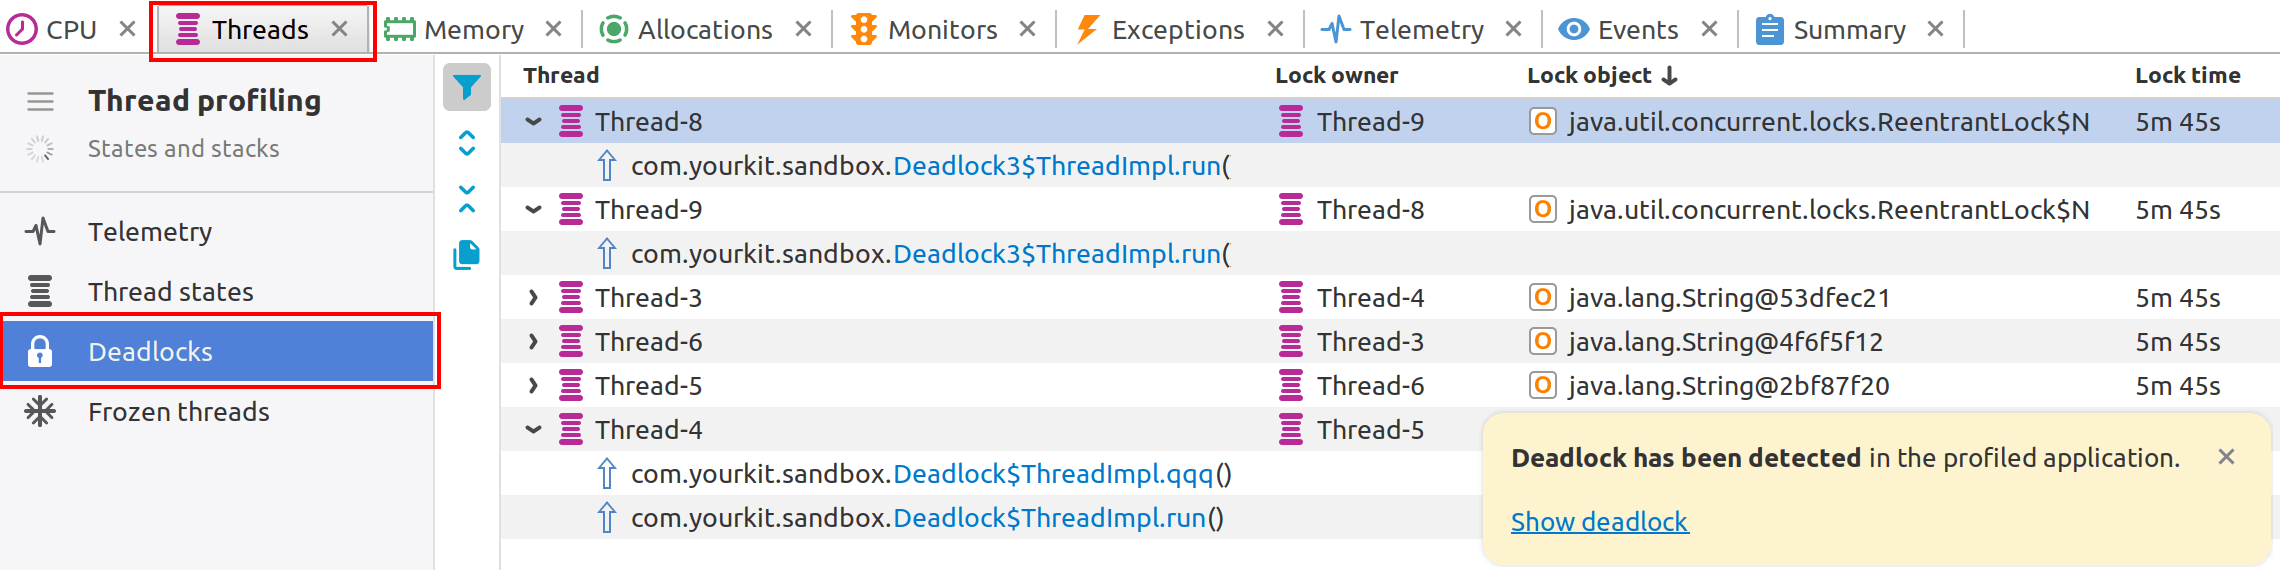
Detected deadlocks are presented in a table with key columns that help identify the source and understand impact:
- Thread : The blocked thread attempting to acquire the lock, along with the thread's stacktrace.
- Lock owner : The thread currently holding the lock, preventing the blocked thread from proceeding.
- Lock object : The lock object instance, that the blocked thread is trying to acquire, represented by its class name and identity hash code.
- Lock time : The duration since the deadlock was first detected, helping assess its persistence and impact on application performance.
Toolbar
-
 :
Apply filters to this view.
:
Apply filters to this view.
-
 :
Expand all threads to show stacks.
:
Expand all threads to show stacks.
-
 :
Collapse all threads to hide stacks.
:
Collapse all threads to hide stacks.
-
 :
Copy all stack traces.
:
Copy all stack traces.