- System requirements
- Profiler architecture
- Profiler installation
- Uninstall profiler
- Running the profiler
- Profiler activation
- Welcome screen
- Start profiling
- Profiling overhead
- Snapshots
- Solving performance problems
- CPU profiling
- Thread profiling
- Virtual threads support
- Object allocation profiling
- Memory profiling
- Monitor profiling
- Exception profiling
- Telemetry
- Probes: monitor events of various kinds
- Inspections: automatic recognition of typical problems
- Automatically trigger actions on event
- Automatic deobfuscation
- Summary
- Filters
- Profiler command line
- Export of profiling results to external formats
- Profiler Java API
- Profiler HTTP API
- Settings
- Troubleshooting and FAQ
Comparing memory snapshots
While capturing a single memory snapshot can provide invaluable information, comparing multiple snapshots can deliver insights into how memory is being used over time. By systematically capturing and comparing key metrics before and after changes, you can scientifically measure the impact of your optimizations, thereby turning the often murky waters of performance tuning into a more clear-cut, data-driven activity.
How to compare memory snapshots
To compare snapshots, do the following:
- Open two memory snapshots you want to compare.
- Select one of them.
- Use File | Compare Snapshot with... (also available from the popup menu) and select the snapshot to compare with.
When comparing memory snapshots, there is an option to choose objects of which reachability scopes to be included to the comparison results:
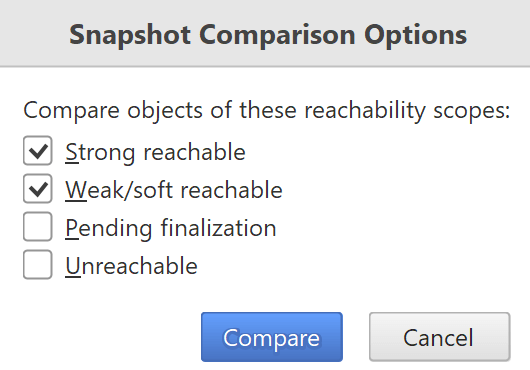
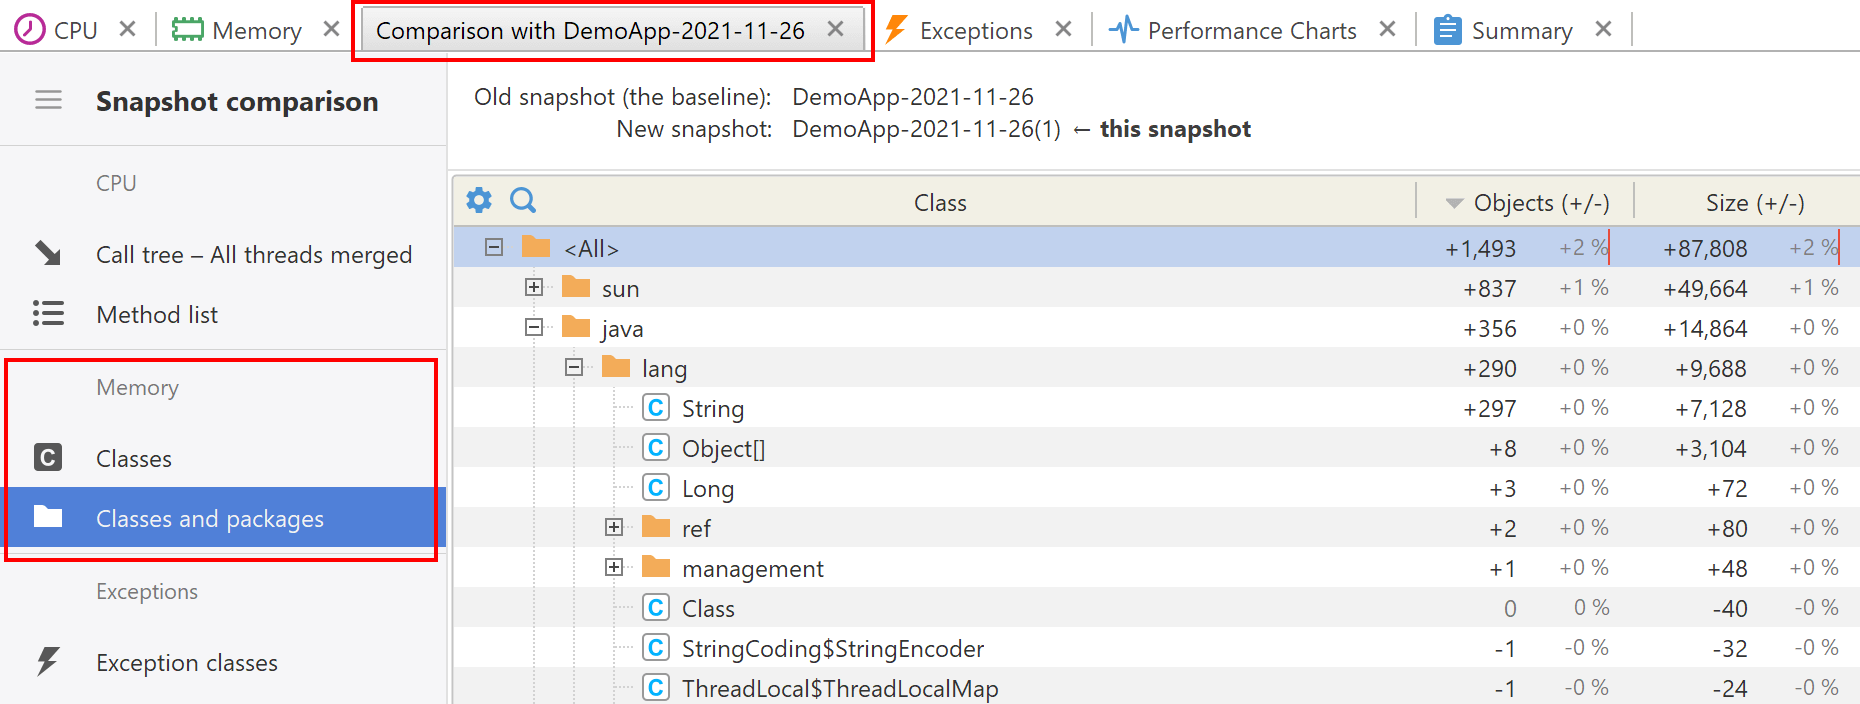
A new tab with the comparison opens. It contains Classes and Classes and packages views displaying two columns: Objects (+/-) and Size (+/-). These columns show the differences in object counts and sizes. Positive values mean that Snapshot 2 (the later memory state) has more objects and/or its objects have the bigger total size.
100% of size corresponds to the total size of all objects in the old snapshot. Likewise, 100% of count corresponds to the object count in the old snapshot.
Please note that memory snapshot comparison provides only object count and size difference, it cannot tell which particular objects have gone or have been created between the snapshots being compared. This is because an object in the JVM heap does not essentially have a persistent ID. An object identifier is valid in particular snapshot only, it is in fact the object's physical address which may alter when the garbage collector compacts the heap or moves objects between heap generations. To address this limitation and enable object identification, YourKit Java Profiler offers the object generations feature whose implementation involves object tagging with the help of the JVMTI API.
Why is comparing useful?
- Identifying memory leaks: By comparing two memory snapshots, you can identify objects that are unnecessarily consuming memory and potentially causing leaks.
- Spotting trends: Comparing multiple snapshots allows you to spot trends and anomalies that may not be apparent in a single snapshot.
- Regression analysis: Facilitates identifying performance regressions when new versions are released.
When to compare memory snapshots
- After deploying fixes: To validate that a memory leak or other issue has been resolved.
- During peak load: Comparing snapshots before, during, and after peak load conditions can reveal how your application behaves under stress.
- Periodically during long-running processes: This helps to ensure that memory consumption remains stable over time.