- System requirements
- Profiler architecture
- Profiler installation
- Uninstall profiler
- Running the profiler
- Profiler activation
- Welcome screen
- Start profiling
- Profiling overhead
- Snapshots
- Solving performance problems
- CPU profiling
- Thread profiling
- Virtual threads support
- Object allocation profiling
- Memory profiling
- Monitor profiling
- Exception profiling
- Telemetry
- Probes: monitor events of various kinds
- Inspections: automatic recognition of typical problems
- Automatically trigger actions on event
- Automatic deobfuscation
- Summary
- Filters
- Profiler command line
- Export of profiling results to external formats
- Profiler Java API
- Profiler HTTP API
- Settings
- Troubleshooting and FAQ
Comparing performance snapshots
Comparing performance snapshots is an invaluable technique in the performance tuning process. By systematically capturing and comparing key metrics before and after changes, you can scientifically measure the impact of your optimizations, thereby turning the often murky waters of Java performance tuning into a more clear-cut, data-driven activity.
How to compare performance snapshots
To compare snapshots, do the following:
- Open two performance snapshots you want to compare.
- Select one of them.
- Use File | Compare Snapshot with... (the action is also available from the popup menu) and select a snapshot to compare with.
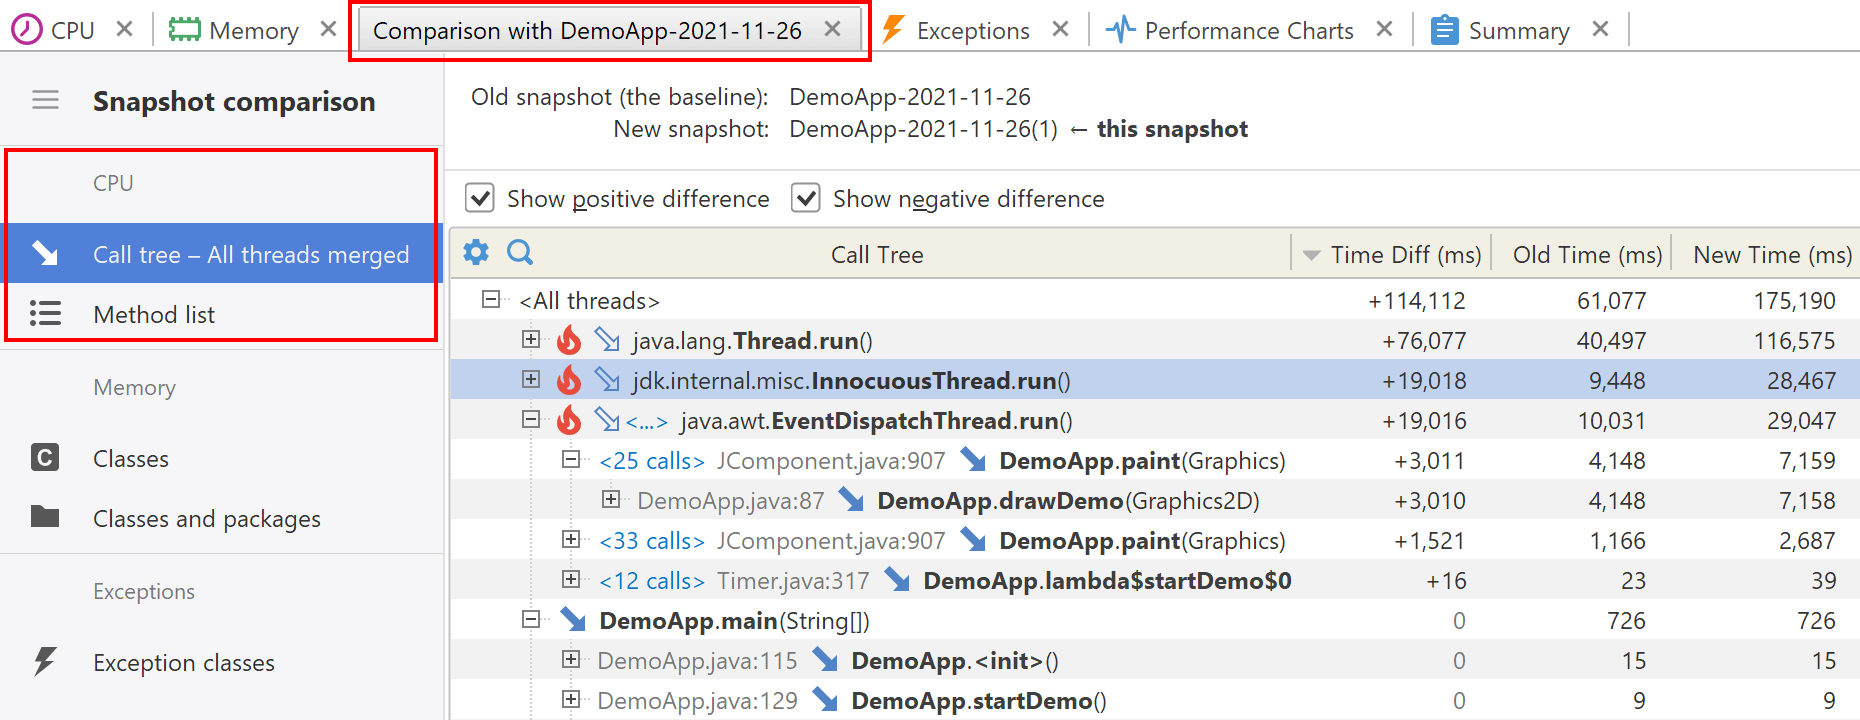
A new tab with the comparison opens. It contains Call tree - All threads merged and Method list views displaying the differences in method execution times and invocation counts. The invocation count column is shown only if both compared snapshots contain CPU tracing results.
Why is comparing useful?
- Identify trends: By comparing snapshots, you can identify trends or anomalies in the performance metrics.
- Measure impact: It allows you to quantify the impact of changes, whether it's a new feature, bug fix, or configuration change.
- Regression analysis: Facilitates identifying performance regressions when new versions are released.
When to compare performance snapshots
- Before and after code changes: To measure the impact of optimizations or new features.
- Version updates: Whenever you update the Java version, libraries, or other dependencies.
- After infrastructure changes: Whenever there are significant changes to the underlying infrastructure.