- System requirements
- Profiler architecture
- Profiler installation
- Uninstall profiler
- Running the profiler
- Profiler activation
- Welcome screen
- Start profiling
- Profiling overhead
- Snapshots
- Solving performance problems
- CPU profiling
- Thread profiling
- Virtual threads support
- Object allocation profiling
- Memory profiling
- Monitor profiling
- Exception profiling
- Telemetry
- Probes: monitor events of various kinds
- Inspections: automatic recognition of typical problems
- Automatically trigger actions on event
- Automatic deobfuscation
- Summary
- Filters
- Profiler command line
- Export of profiling results to external formats
- Profiler Java API
- Profiler HTTP API
- Settings
- Troubleshooting and FAQ
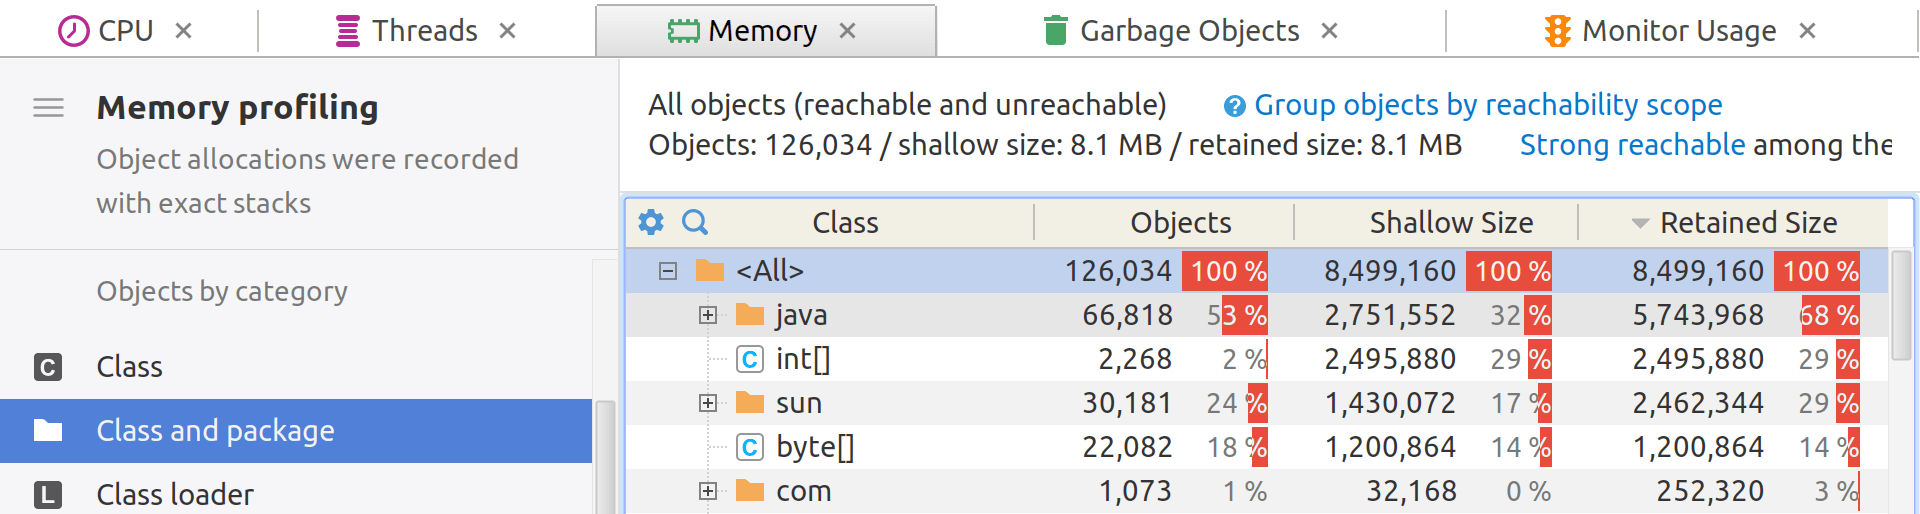
Group objects by class and package
When analyzing a Java memory snapshot, understanding the structure of objects in memory can offer invaluable insights into your application's performance and resource consumption. One effective way to do this is by grouping objects by their classes and packages, represented in a tree-like structure.
YourKit Java Profiler allows you to group objects by their classes and packages, and evaluate how much memory they use:
Why group by classes and packages?
1. Simplifies analysis: Grouping objects by their classes and packages provides a logical structure that's easy to navigate.
2. Identifies memory leaks: If a specific package or class is consuming too much memory, you might suspect a memory leak, or consider refactoring the code.
3. Performance Tuning: Understanding the memory footprint of different classes can help you fine-tune your application for better performance.
Practical tips
1. Focus on large consumers: Begin your analysis by focusing on packages or classes that consume the most memory.
2. Isolate anomalies: If you see a class with an unusually high number of instances or memory consumption, delve deeper to identify the root cause.