- System requirements
- Profiler architecture
- Profiler installation
- Uninstall profiler
- Running the profiler
- Profiler activation
- Welcome screen
- Start profiling
- Profiling overhead
- Snapshots
- Solving performance problems
- CPU profiling
- Thread profiling
- Virtual threads support
- Object allocation profiling
- Memory profiling
- Monitor profiling
- Exception profiling
- Telemetry
- Probes: monitor events of various kinds
- Inspections: automatic recognition of typical problems
- Automatically trigger actions on event
- Automatic deobfuscation
- Summary
- Filters
- Profiler command line
- Export of profiling results to external formats
- Profiler Java API
- Profiler HTTP API
- Settings
- Troubleshooting and FAQ
Snapshot annotation
Debugging performance issues in Java applications can be a daunting task. When analyzing performance or memory snapshots, it's easy to get lost in the sea of objects, classes, and methods. Snapshot annotations come to the rescue by providing a way to add meaningful comments and notes directly to your snapshots. This feature enhances your debugging and profiling tasks, making it easier to share insights with team members or even your future self.
- What are snapshot annotations?
- Annotate snapshot from profiler UI
- Annotate snapshot via profiler API
What are snapshot annotations?
Snapshot annotations are free-form text metadata that you can attach to the snapshot file. These annotations serve as inline comments, providing additional context or highlighting crucial information about the snapshot.
Annotate snapshot from profiler UI
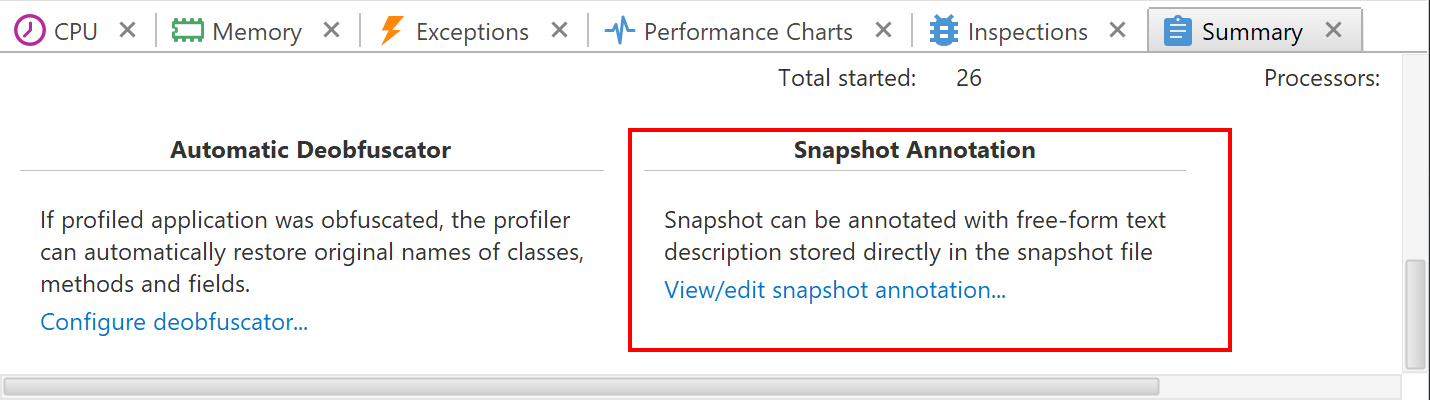
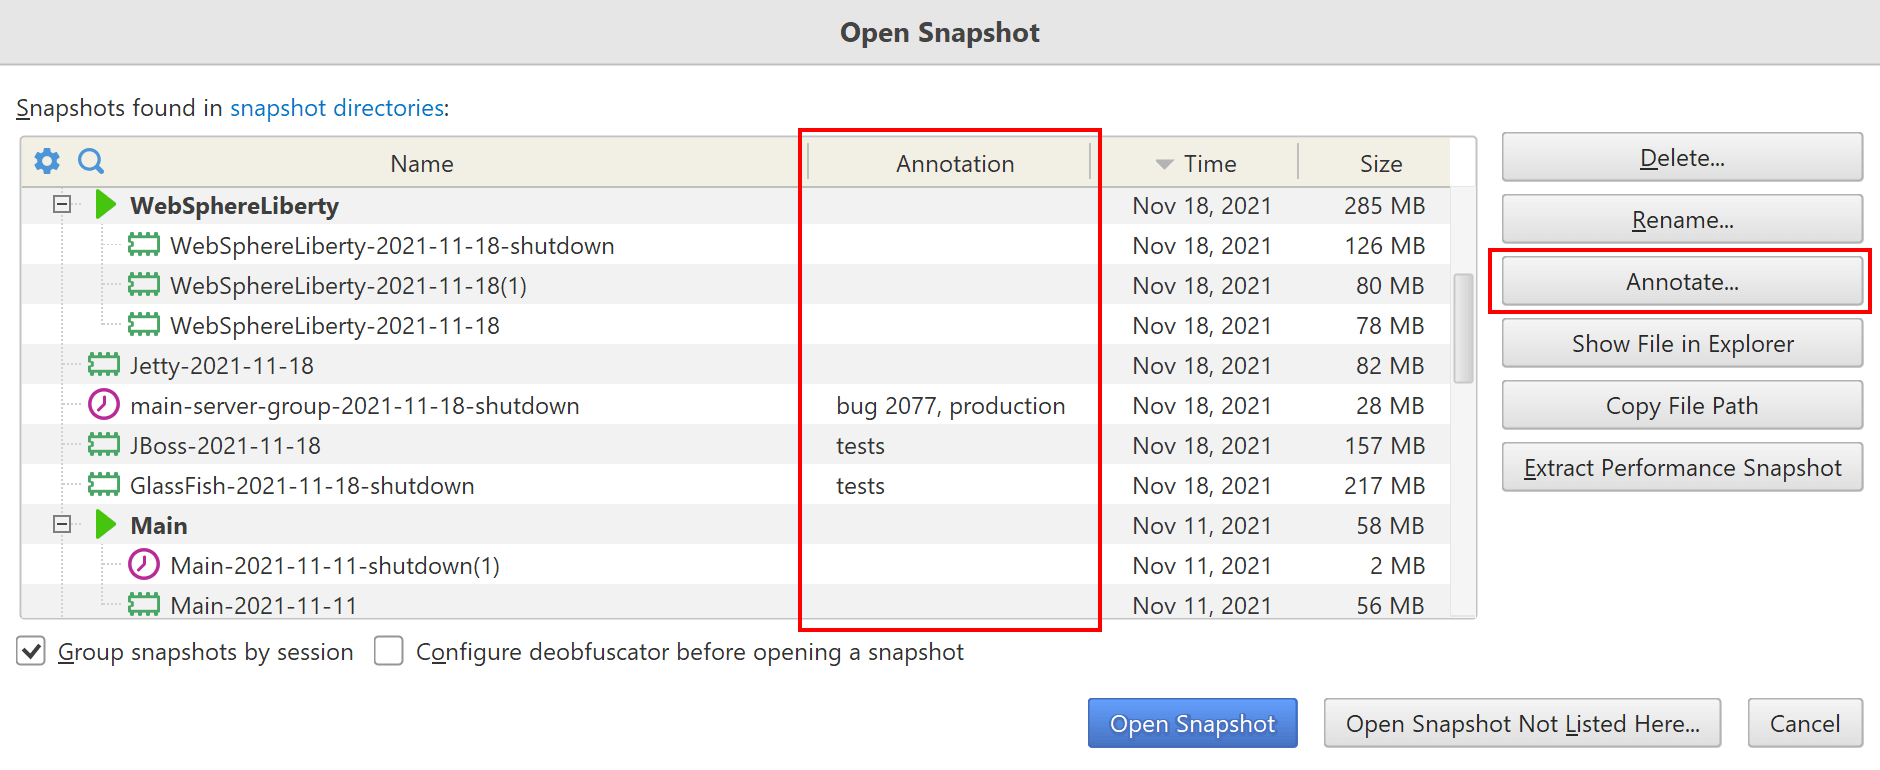
You can view and edit annotations from different parts of the user interface:
1) Welcome screen
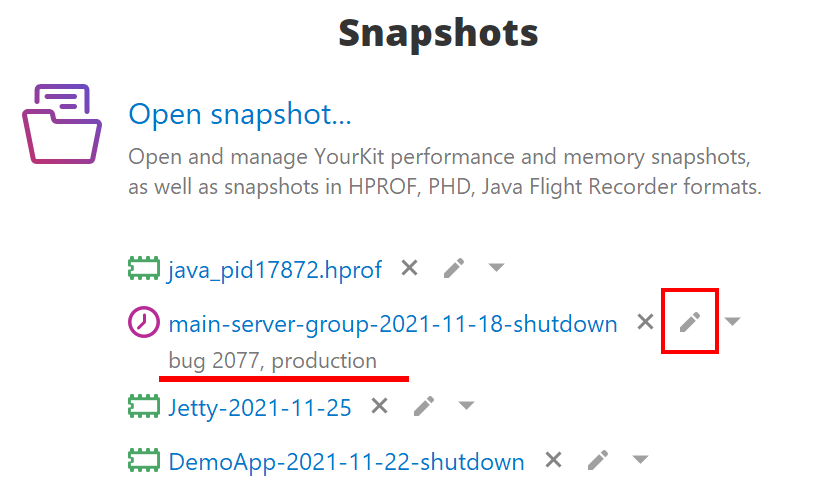
2) Summary tab
3) Open Snapshot window
Annotate snapshot via profiler API
The profiler has a dedicated Java API for programmatic annotation of snapshots.