- System requirements
- Profiler architecture
- Profiler installation
- Uninstall profiler
- Running the profiler
- Profiler activation
- Welcome screen
- Start profiling
- Profiling overhead
- Snapshots
- Solving performance problems
- CPU profiling
- Thread profiling
- Virtual threads support
- Object allocation profiling
- Memory profiling
- Monitor profiling
- Exception profiling
- Telemetry
- Probes: monitor events of various kinds
- Inspections: automatic recognition of typical problems
- Automatically trigger actions on event
- Automatic deobfuscation
- Summary
- Filters
- Profiler command line
- Export of profiling results to external formats
- Profiler Java API
- Profiler HTTP API
- Settings
- Troubleshooting and FAQ
Monitor owner thread
Monitor owner thread view displays a list of threads that acted as blockers during monitor wait operations, along with the average block time, total block time, and block count for each thread. This view provides insights into which threads held monitors, causing other threads to wait. When a blocker thread is selected, related information such as call trees, backtraces, and the monitor class involved in the wait operation is shown in the secondary views below, offering a comprehensive analysis of thread synchronization behavior.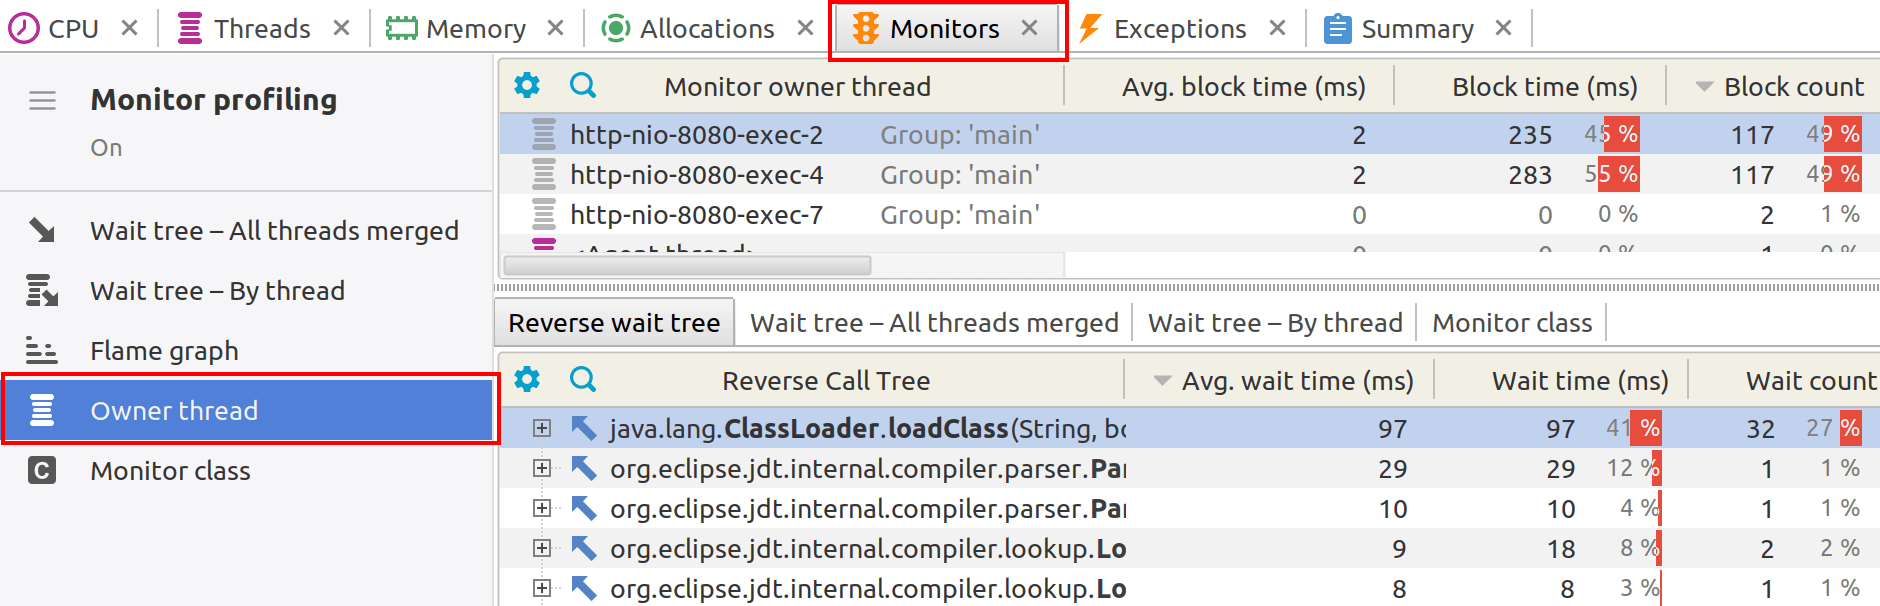
Actions
The following actions are available in the popup menu:
- Lines can be copied by using File | Copy (Ctrl+C).
- File | Export to... (Ctrl+S) - exports view to different formats.
- Tools | Open in IDE (F7) - opens method declaration in IDE editor. See IDE integration.