
- System requirements
- Profiler architecture
- Profiler installation
- Uninstall profiler
- Running the profiler
- Profiler activation
- Welcome screen
- Start profiling
- Profiling overhead
- Snapshots
- Solving performance problems
- CPU profiling
- Thread profiling
- Object allocation profiling
- Memory profiling
- Exception profiling
- Telemetry
- Probes: monitor higher level events
- Inspections: automatic recognition of typical problems
- Automatically trigger actions on event
- Automatic deobfuscation
- Summary, automatic deobfuscation
- Filters
- Profiler command line
- Command line tool to control profiling
- Export of profiling results to external formats
- Profiler .NET API
- Profiler HTTP API
- Settings
- Troubleshooting
CPU hot spots
Hot spots shows methods that consumed the most time. The host spots list is similar to the method list sorted by time, but it excludes the methods which do not consume time itself. I.e if the time was consumed only in called methods, then the caller method is not a host spot. In other words the most important methods for application performance are shown.
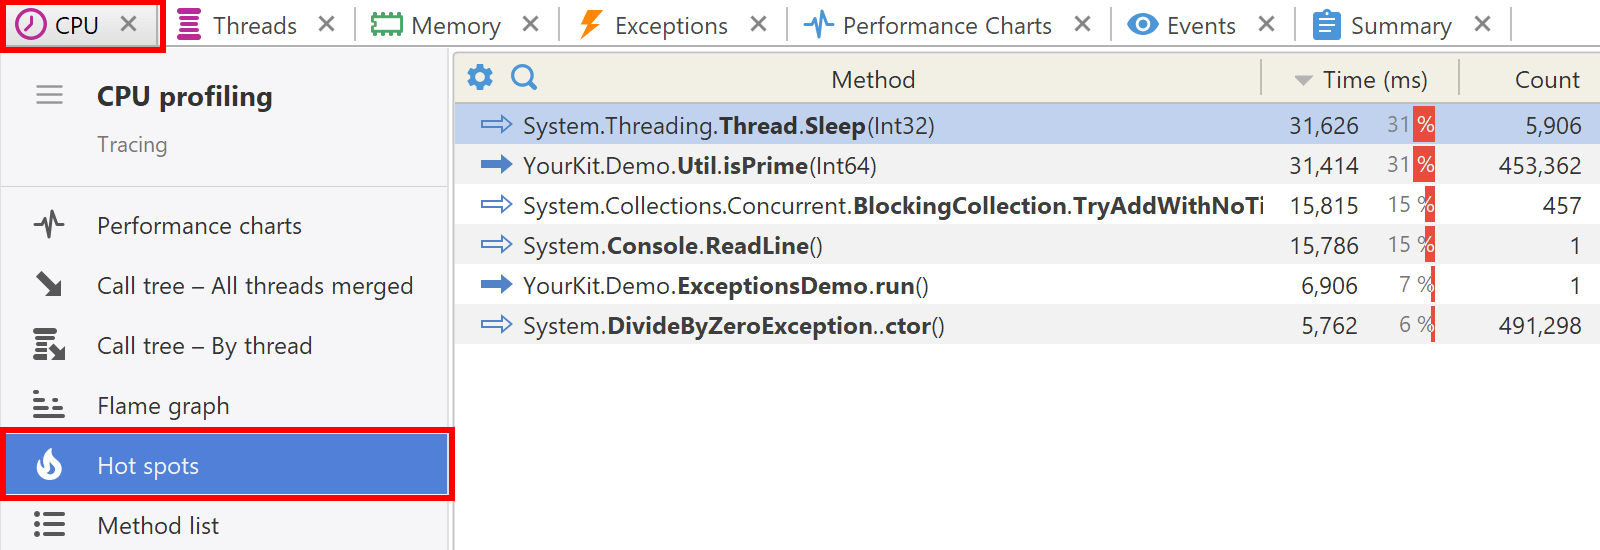
The hot spots are calculated based on current filters. Every time you change filters, you get the new list of hot spots.
Actions
The following actions are available in the popup menu:
- CPU | Method Merged Callees (Ctrl+M) - shows the method's merged callees.
- CPU | Method Back Traces (Ctrl+Shift+M) - shows the method's back traces.
- Tools | Open in IDE (F7) - opens method declaration in IDE editor (see IDE integration).