
- System requirements
- Profiler architecture
- Profiler installation
- Uninstall profiler
- Running the profiler
- Profiler activation
- Welcome screen
- Start profiling
- Profiling overhead
- Snapshots
- Solving performance problems
- CPU profiling
- Thread profiling
- Object allocation profiling
- Memory profiling
- Exception profiling
- Telemetry
- Probes: monitor higher level events
- Inspections: automatic recognition of typical problems
- Automatically trigger actions on event
- Automatic deobfuscation
- Summary, automatic deobfuscation
- Filters
- Profiler command line
- Command line tool to control profiling
- Export of profiling results to external formats
- Profiler .NET API
- Profiler HTTP API
- Settings
- Troubleshooting
Callee list view
Callee list view shows which methods were called from certain methods. It is available as a dependent view in call tree, hot spots and method list:
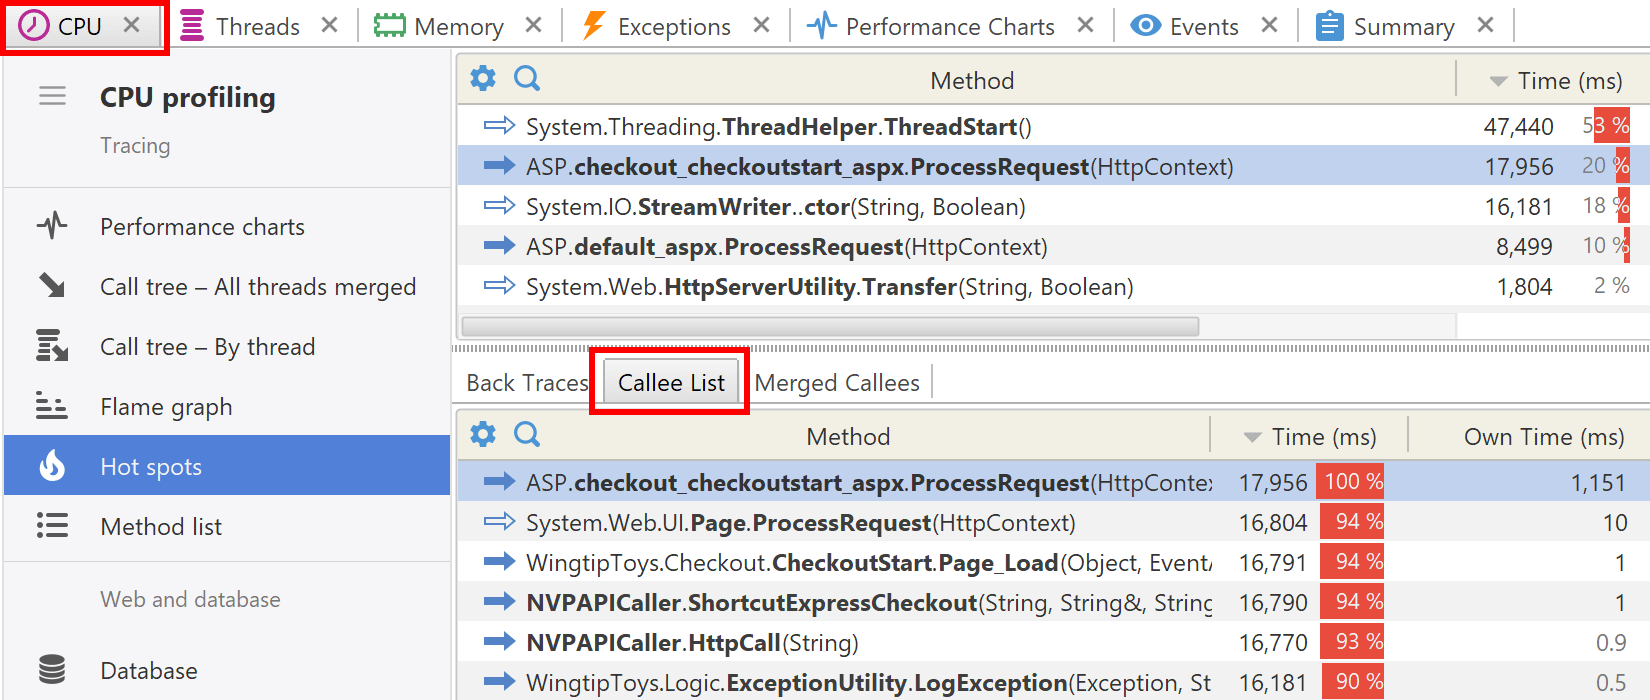
Callee list for "Call tree" shows methods invoked inside a selected subtree. When you view "Call tree - By thread", callee list will show methods invoked in the subtree in particular thread only. To see all methods invoked in a thread, select the thread node.
Callee list for "Hot spots" and "Method list" shows methods invoked inside a selected method.