Changes in version 2019.8
- CPU profiling
- Memory profiling
- JVM support
- IDE integration
- User interface
- Triggers
- Probes and inspections
- Miscellaneous
- Deprecations
CPU profiling
-
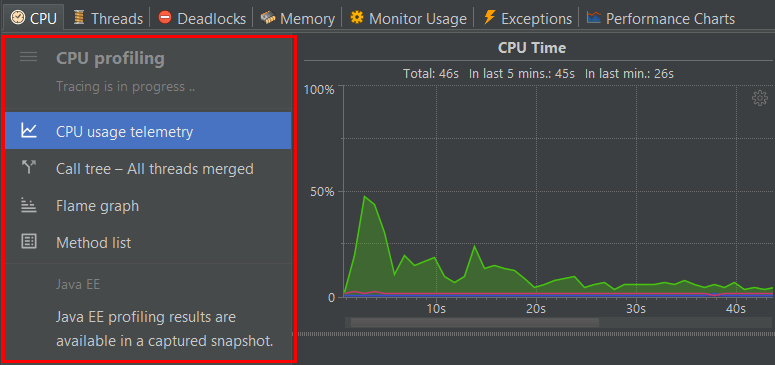
CPU flame graph. It is a new way to visualize entire application call tree, which allows to find performance bottlenecks quickly and easily. Execution paths which consume most of the CPU time are wider and more visible on the graph.

-
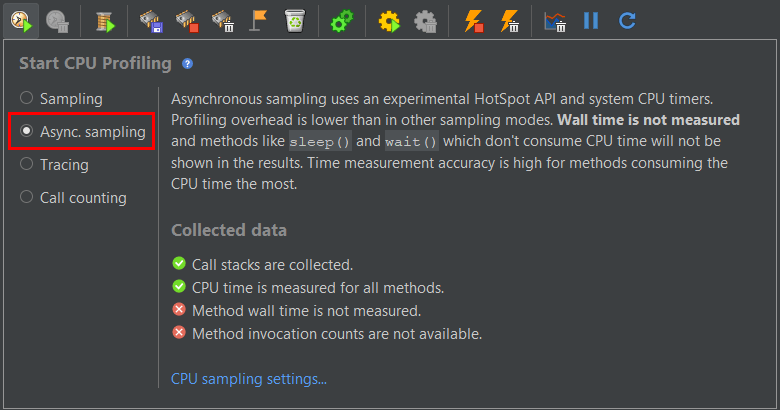
Asynchronous sampling. It is a highly requested CPU profiling mode, which provides much better accuracy of collected stack traces. It uses an experimental HotSpot API and system CPU timers. This mode is available only on macOS, Linux x86, Linux x64.
-
Startup options: new option
async_sampling_cputo start asynchronous sampling from command line. -
Profiler API: new method
com.yourkit.api.Controller.startAsyncSamplingCpu(String)to start asynchronous sampling. -
Command line tool:
new command
start-async-sampling-cpu. - Sampling accuracy significantly improved, especially when measuring with wall time.
- Bug fixed: call counting might not work in Java 9+.
Memory profiling
-
UI: object explorer: class-specific object presentation:
for instances of
java.util.Optional*the value is immediately shown if available, otherwise shown asEmpty.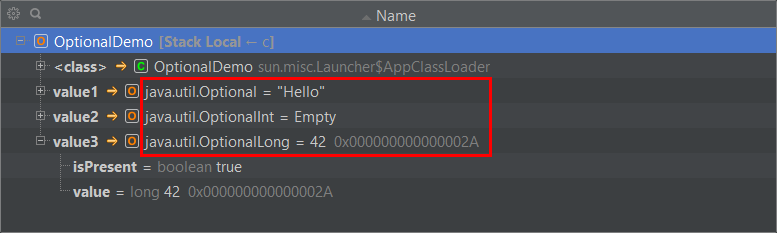
-
UI: persistent object IDs assigned in probes or triggers (see changes in Triggers section) are now more accessible in a memory snapshot:
- persistent object ID is shown in Object explorer, if available;
-
new action
Memory | (Find) Objects by Persistent IDsearches for objects with particular IDs, or for all objects with the ID assigned.
- Bug fixed: allocated object counting might not work in Java 9+.
JVM support
- Java 13 supported.
- Deprecated in version 2019.1 Java 6 support has been discontinued. Therefore, YourKit Java Profiler 2019.1 is the last version supporting Java 6.
- OpenJ9 JVMs are now visible in application table on Linux and macOS.
- Remote attach to OpenJ9 JVM is improved.
IDE integration
- Eclipse: supported "Jetty Webapp" run configuration for Eclipse Jetty Plugin.
- Eclipse 2019-06 (4.12) is supported.
- IntelliJ IDEA 2019.2 is supported.
- MyEclipse CI 2019.4 is supported.
- NetBeans 11.1 is supported.
User interface
-
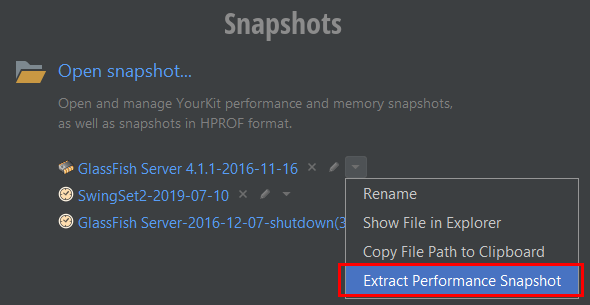
Extract Performance Snapshot is now accessible in the recent snapshot list.
-
Navigation drawer has been modernized to improve usability and look. As the result, profiling status is now visible at the header. Drawer is vertically scrollable. And you can also collapse it horizontally to give more space to other views with profiling results.
- Copy File Path is now available in the "Open Snapshot" dialog.
Triggers
-
New trigger action
StartAsyncSamplingCpu. -
New parameter
PERSISTENT_IDfor on-method-invocation trigger macrosTHIS,PARAMSandRETURN_VALUEavailable inPrint*actions helps identify involved objects by assigning and reporting their persistent IDs.The IDs can be seen and searched for in a memory snapshot. See changes in Memory profiling for detail.
- Some trigger actions have been renamed.
Probes and inspections
-
Built-in probe
com.yourkit.probes.builtin.DirectoryStreamsreworked to be consistent with other similar probes. Its default activity mode is now Auto. - New inspection Not closed directory streams has been implemented. The inspection finds and reports directory streams that have not been closed so far, because non-closed streams is a resource leak.
Miscellaneous
- Attach mode: improved responsiveness and reliability.
- Attach mode: supported on AIX for Java 8+ HotSpot and OpenJ9 JVMs.
-
Linux ARM agent directory names have been changed to
linux-arm-32for ARM 32-bit (ARMv7 and higher, hard-float) andlinux-arm-64for ARM 64-bit (AArch64). Linux ARM soft-float is no longer supported. -
Automatic deobfuscation: Profiler supports deobfuscation of MCP mapping widely used in Minecraft mod development.

-
New agent startup option
skip_advanced_port_checkaffects the profiler agent port availability checks. When this option is specified, the agent does not explicitly reject ports used by other currently running profiled processes. Instead, the agent port availability is proved only by actually opening it. This option is useful in special environments such as Kubernetes, where PID reuse is possible. See this forum thread for detail. -
API: caveat: a number of profiler API methods
in
com.yourkit.api.Controllerclass were renamed. Methods with old names were deprecated. - Snapshot comparison: bug fixed: exception difference was not available if the "Exceptions" tab has not been selected at least once in the both snapshots being compared before using the comparison action
Deprecations
Deprecation means that we intend to remove the feature or capability from a future release of YourKit Java Profiler. The feature or capability will continue to work and is fully supported until it is officially removed.
-
Deprecated methods from
com.yourkit.api.Controllerare scheduled for removal in the next release of YourKit Java Profiler.