- System requirements
- Profiler architecture
- Profiler installation
- Uninstall profiler
- Running the profiler
- Profiler activation
- Welcome screen
- Start profiling
- Profiling overhead
- Snapshots
- Solving performance problems
- CPU profiling
- Thread profiling
- Virtual threads support
- Object allocation profiling
- Memory profiling
- Monitor profiling
- Exception profiling
- Telemetry
- Probes: monitor events of various kinds
- Inspections: automatic recognition of typical problems
- Automatically trigger actions on event
- Automatic deobfuscation
- Summary
- Filters
- Profiler command line
- Export of profiling results to external formats
- Profiler Java API
- Profiler HTTP API
- Settings
- Troubleshooting and FAQ
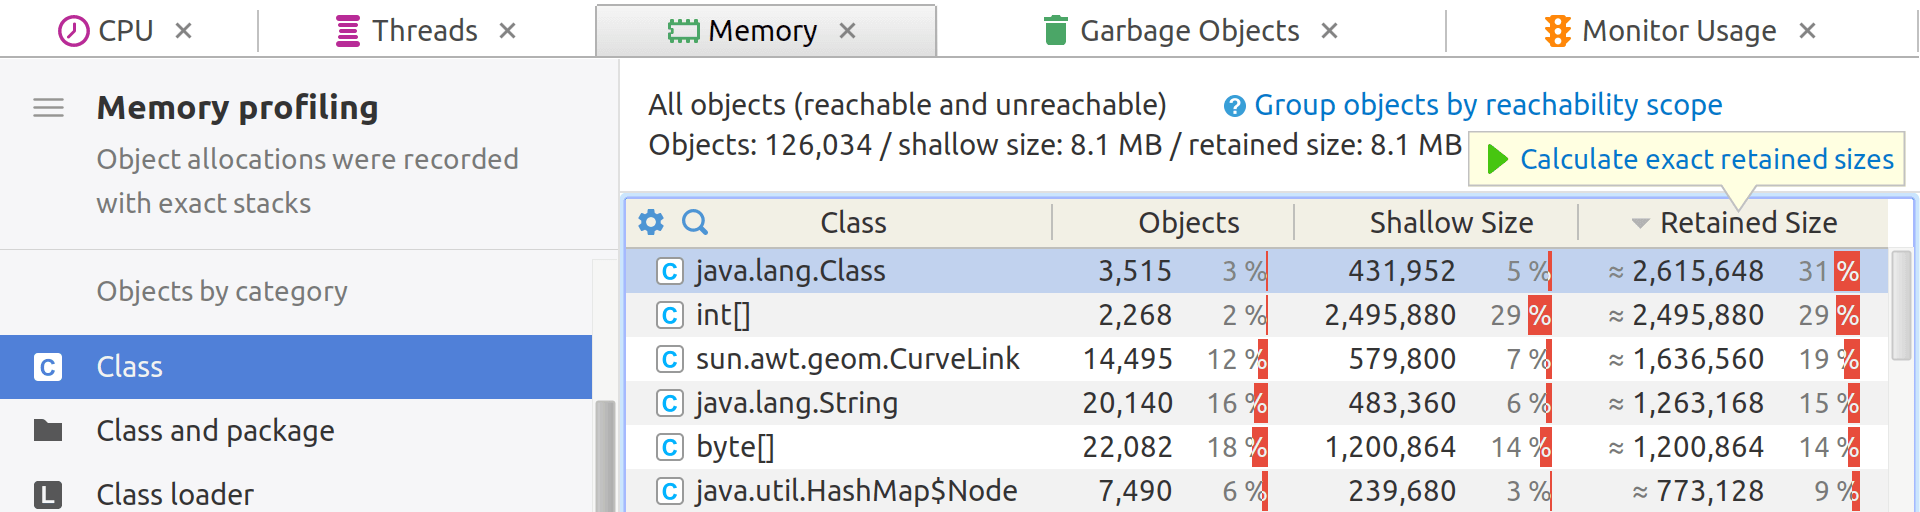
Group objects by class
One effective technique of Java memory profiling involves grouping objects by their classes to evaluate the resource usage and potential bottlenecks.
YourKit Java Profiler allows you to group objects by their classes, and evaluate how much memory they use. Upon accessing the view, you'll find presented the estimated retained sizes instead of precise measurements, as the latter might not be readily calculable. To obtain accurate measurements, click on the Calculate exact retained sizes tooltip located above the Retained Size column. Nonetheless, for the majority of classes, the estimated size closely approximates the exact value.
Why group objects by classes?
Instant visibility
When objects are grouped by their classes you instantly get a holistic view of the resource allocation. This aids in identifying which classes are consuming the most resources.
Easier analysis
When looking at a large heap dump, knowing the proportion of memory consumed by each class can help pinpoint potential areas for optimization.
Anomaly detection
Unusual amounts of instances for a particular class could indicate a design issue or a memory leak, thus serving as a red flag for deeper investigation.
Pinpointing memory leaks
Identifying suspects
Grouping by classes can also help identify potential memory leaks. If you notice a specific class continually increasing in instance count during your testing cycle without ever decreasing, that's a potential leak.
Path to GC roots
Use YourKit Java Profiler to analyze the path to the Garbage Collector (GC) roots for instances of suspicious classes. If there's no valid reason for the object to be retained, you've likely found a memory leak.