- System requirements
- Profiler architecture
- Profiler installation
- Uninstall profiler
- Running the profiler
- Profiler activation
- Welcome screen
- Start profiling
- Profiling overhead
- Snapshots
- Solving performance problems
- CPU profiling
- Thread profiling
- Object allocation profiling
- Memory profiling
- Exception profiling
- Telemetry
- Probes: monitor higher level events
- Inspections: automatic recognition of typical problems
- Automatically trigger actions on event
- Automatic deobfuscation
- Summary, automatic deobfuscation
- Filters
- Profiler command line
- Command line tool to control profiling
- Export of profiling results to external formats
- Profiler .NET API
- Profiler HTTP API
- Settings
- Troubleshooting
Object allocation telemetry
Object allocation telemetry is a subset of the telemetry data collected by YourKit .NET Profiler that provides statistics on object allocation. Allocation telemetry data is collected only when allocation profiling is running. If object allocations are not profiled, the telemetry charts will be empty.
Telemetry charts
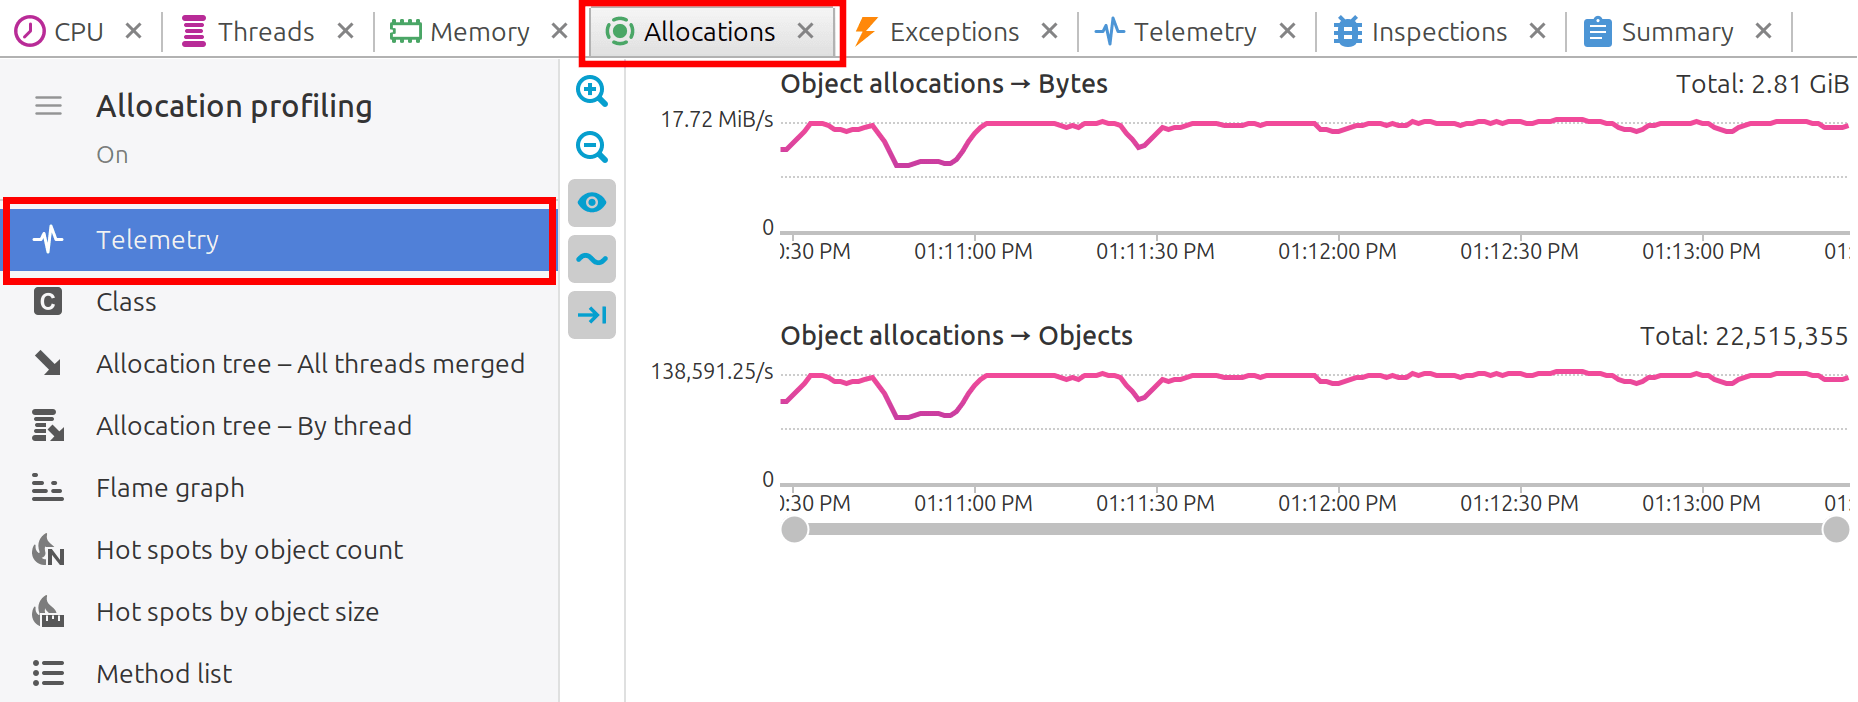
Object allocations > Bytes
Bytes per second chart shows total memory footprint of allocated objects. If the allocated byte rate is high while the object count remains low, it suggests the creation of large objects, which may impact heap usage and GC efficiency.
Object allocations > Objects
The Objects allocated per second chart helps identify peaks in object allocation rates, which may indicate excessive short-lived object creation, leading to frequent garbage collection. A high allocation rate, especially in combination with frequent GC activity, can degrade performance.
Toolbar
-

 :
Zoom in and out to quickly change the range of visible data.
:
Zoom in and out to quickly change the range of visible data.
-
 :
Show "empty" charts, i.e. the charts that have only zero values.
:
Show "empty" charts, i.e. the charts that have only zero values.
-
 :
Smooth out short-term fluctuations on graphs.
This is useful for visualizing of fast-changing data.
:
Smooth out short-term fluctuations on graphs.
This is useful for visualizing of fast-changing data.
-
 :
Control auto-scrolling behavior of telemetry charts.
When toggled, the graphs will be automatically scrolled to the right
when new data arrives.
:
Control auto-scrolling behavior of telemetry charts.
When toggled, the graphs will be automatically scrolled to the right
when new data arrives.
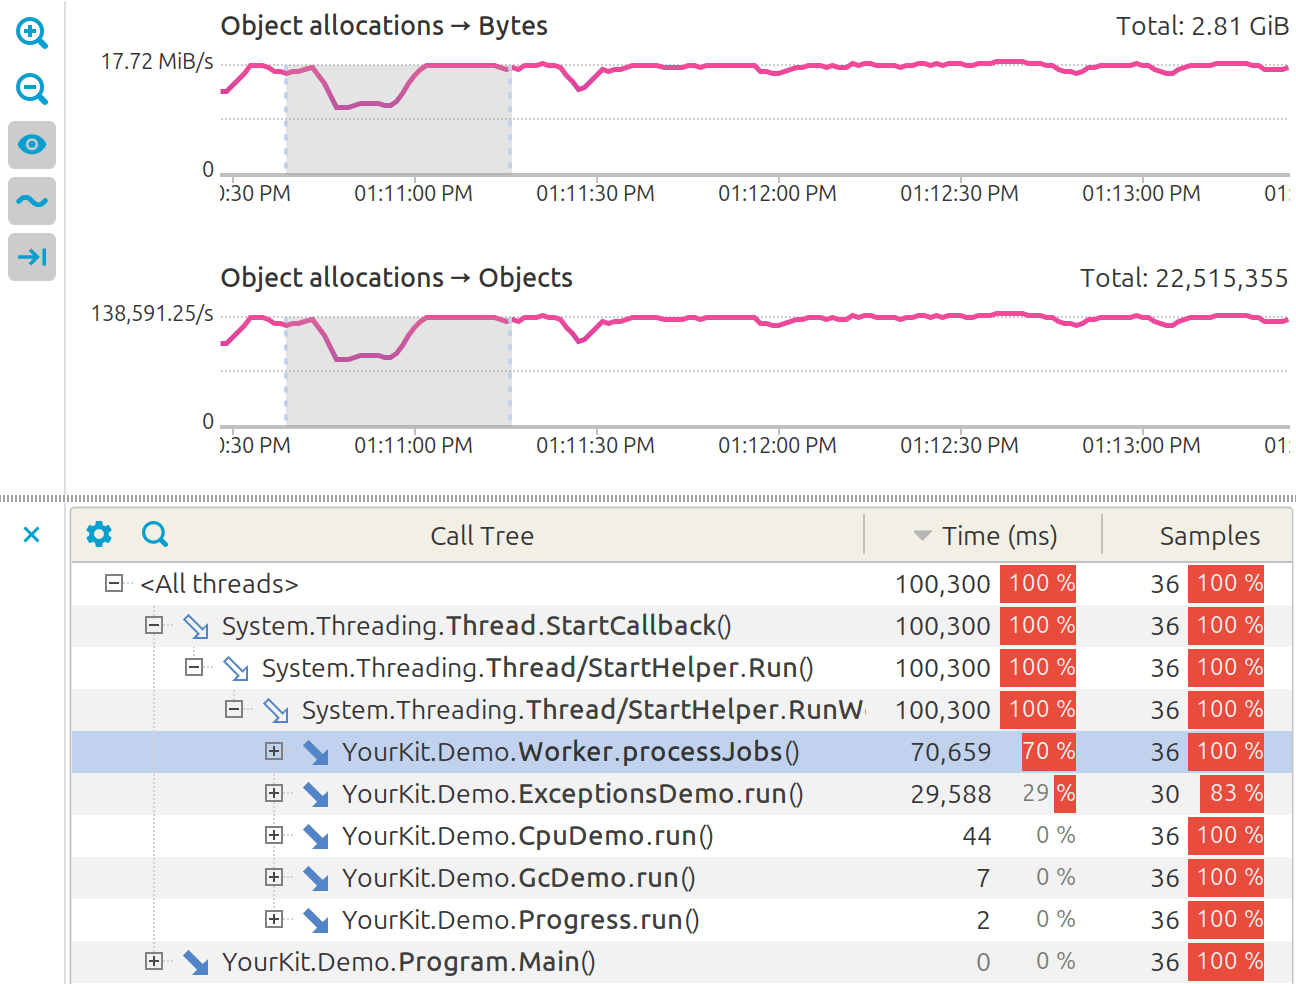
Working with telemetry charts
Clicking on chart: Clicking on a chart reveals the call stacks of the .NET threads running at that specific moment, providing a snapshot of the application's state.
Selecting the time interval: Analyzing performance over a time span is equally straightforward. By selecting a range within the telemetry data, profiler builds an estimated call tree and computes the CPU usage for that interval. This can be invaluable for pinpointing performance bottlenecks or understanding the behavior of the application during periods of high load.