- System requirements
- Profiler architecture
- Profiler installation
- Uninstall profiler
- Running the profiler
- Profiler activation
- Welcome screen
- Start profiling
- Profiling overhead
- Snapshots
- Solving performance problems
- CPU profiling
- Thread profiling
- Object allocation profiling
- Memory profiling
- Exception profiling
- Telemetry
- Probes: monitor higher level events
- Inspections: automatic recognition of typical problems
- Automatically trigger actions on event
- Automatic deobfuscation
- Summary, automatic deobfuscation
- Filters
- Profiler command line
- Command line tool to control profiling
- Export of profiling results to external formats
- Profiler .NET API
- Profiler HTTP API
- Settings
- Troubleshooting
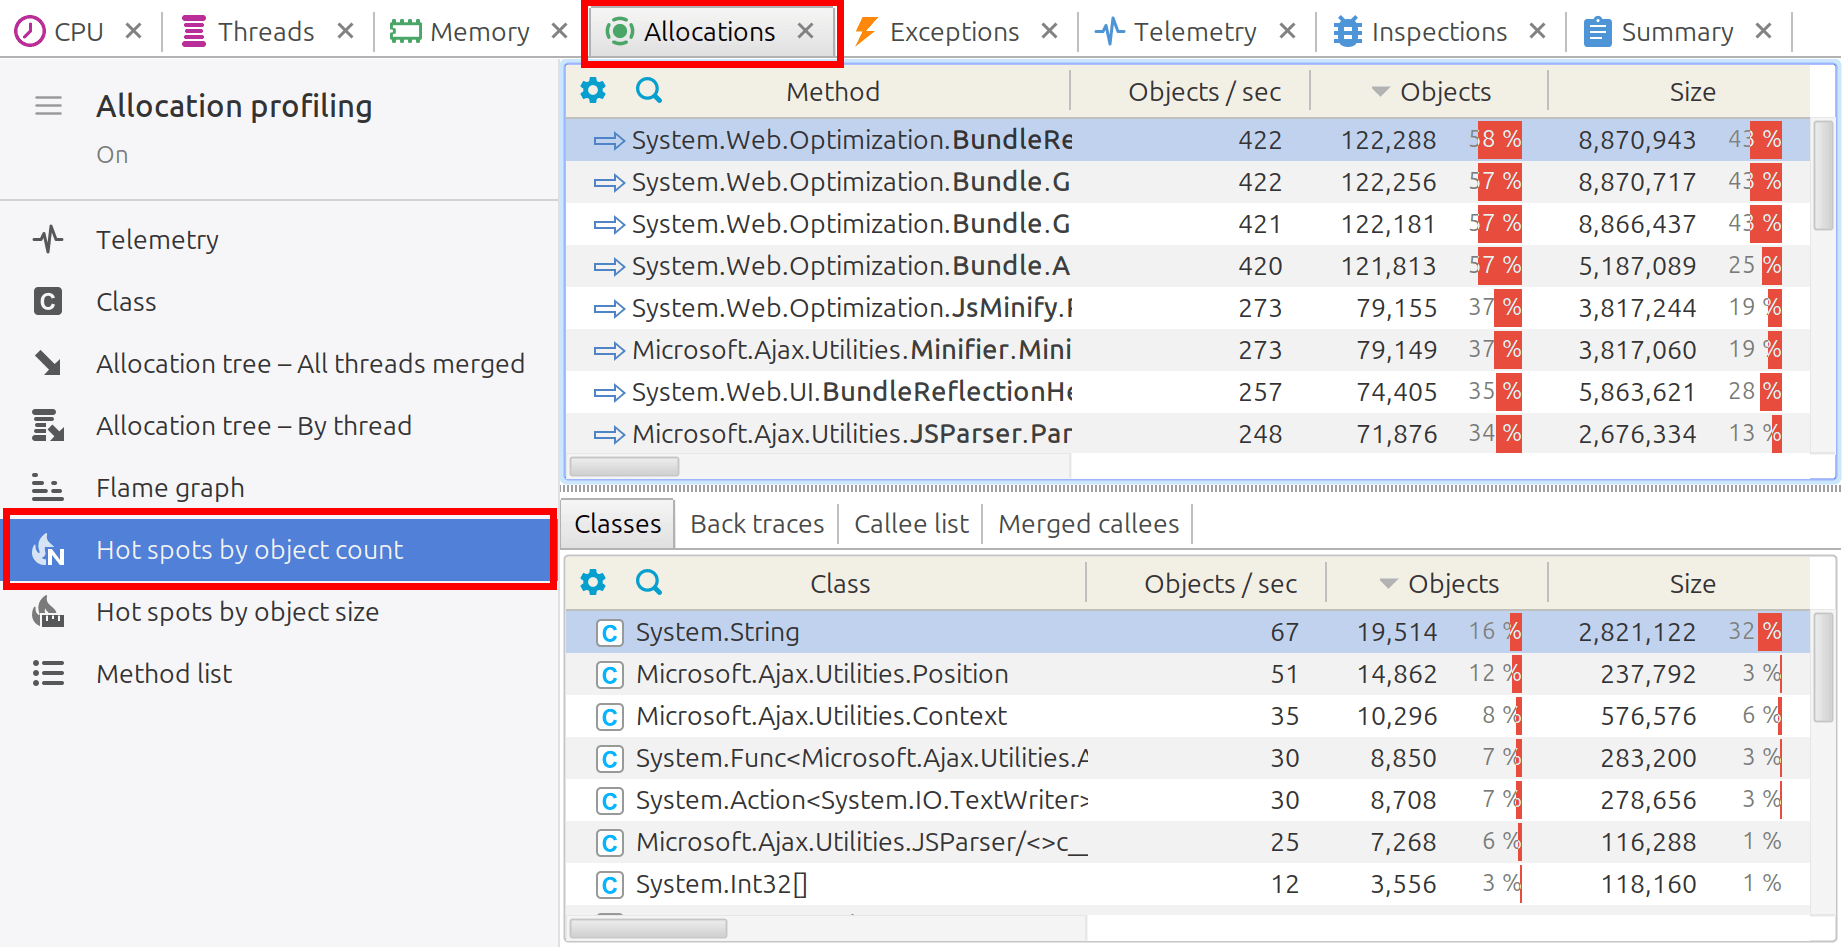
Allocation hot spots by object count
The Allocation hot spots by object count view focuses on identifying the .NET methods that created the most objects during program execution. These methods, referred to as allocation hot spots, are often the root causes of performance issues and are critical to address for improving overall application performance.
The excessive creation of objects in a .NET application can significantly impact performance by increasing memory consumption and triggering more frequent garbage collection events. Each object allocation incurs memory overhead and potentially results in longer execution times as the garbage collector works to reclaim memory from unused objects. This can lead to increased CPU usage, longer response times, and even application slowdowns, making efficient object management a critical consideration for maintaining optimal .NET application performance.
By pinpointing allocation hot spots, you can focus your optimization efforts on the areas that have the most impact on improving the overall performance and efficiency of your .NET application.