- System requirements
- Profiler architecture
- Profiler installation
- Uninstall profiler
- Running the profiler
- Profiler activation
- Welcome screen
- Start profiling
- Profiling overhead
- Snapshots
- Solving performance problems
- CPU profiling
- Thread profiling
- Object allocation profiling
- Memory profiling
- Exception profiling
- Telemetry
- Probes: monitor higher level events
- Inspections: automatic recognition of typical problems
- Automatically trigger actions on event
- Automatic deobfuscation
- Summary, automatic deobfuscation
- Filters
- Profiler command line
- Command line tool to control profiling
- Export of profiling results to external formats
- Profiler .NET API
- Profiler HTTP API
- Settings
- Troubleshooting
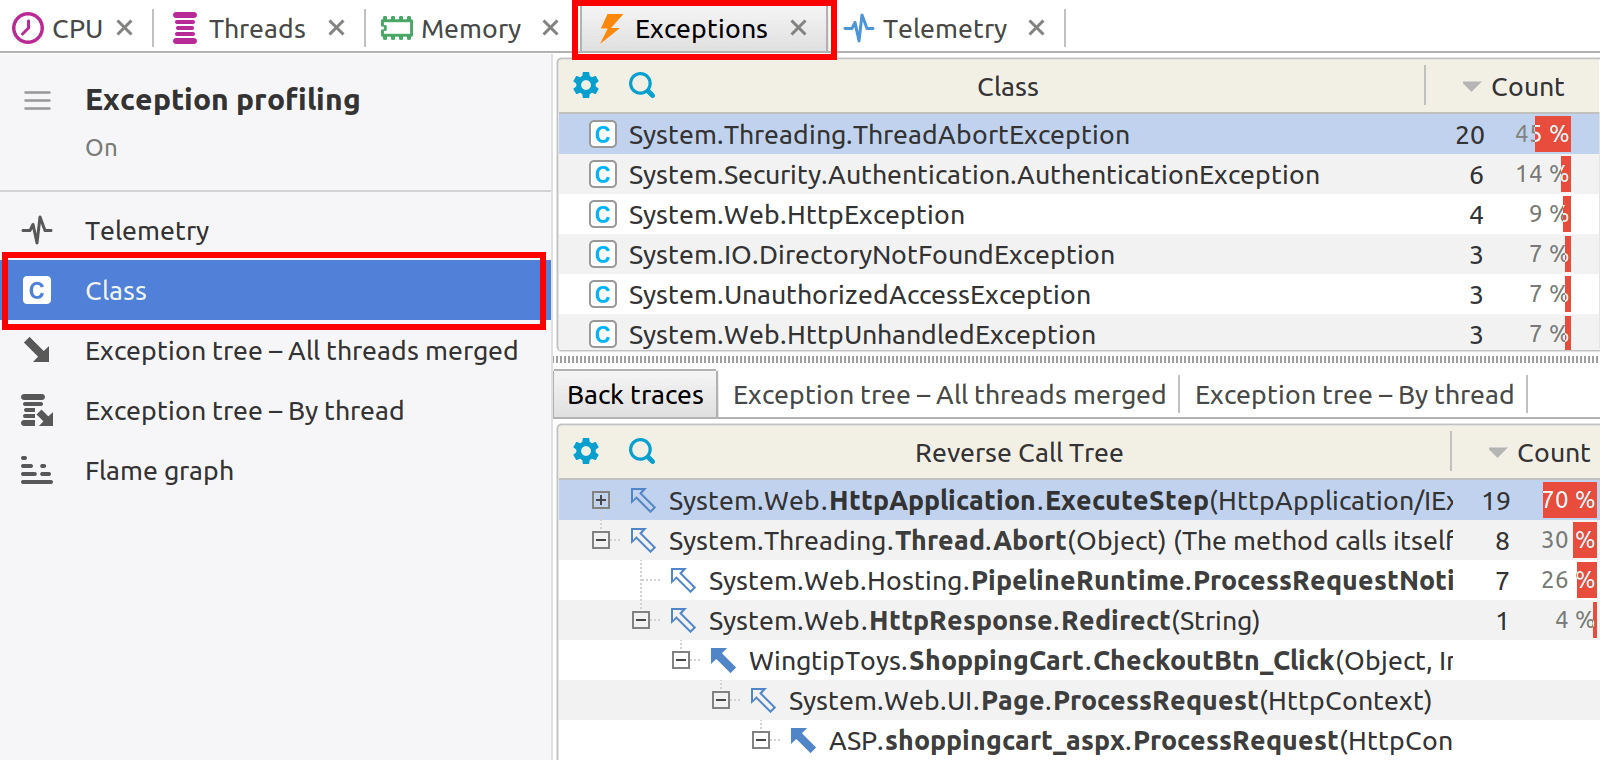
Exception class
Exception class displays a list of exception classes thrown in the application, along with the total number of occurrences for each class. When an exception class is selected in the main table, the related call trees or backtraces are displayed in the secondary views below, offering detailed insights into where these exceptions were thrown.
Actions
The following actions are available in the popup menu:
- Lines can be copied by using File | Copy (Ctrl+C).
- File | Export to... (Ctrl+S) - exports view to different formats.
- Tools | Open in IDE (F7) - opens method declaration in IDE editor. See IDE integration.