- System requirements
- Profiler architecture
- Profiler installation
- Uninstall profiler
- Running the profiler
- Profiler activation
- Welcome screen
- Start profiling
- Profiling overhead
- Snapshots
- Solving performance problems
- CPU profiling
- Thread profiling
- Object allocation profiling
- Memory profiling
- Exception profiling
- Telemetry
- Probes: monitor higher level events
- Inspections: automatic recognition of typical problems
- Automatically trigger actions on event
- Automatically capture snapshot on high memory usage
- Capture snapshots periodically
- Automatic deobfuscation
- Summary, automatic deobfuscation
- Filters
- Profiler command line
- Command line tool to control profiling
- Export of profiling results to external formats
- Profiler .NET API
- Profiler HTTP API
- Settings
- Troubleshooting
Automatically capture snapshot on high memory usage
You can instruct the profiler to automatically capture memory snapshot when used memory reaches the specified threshold.
When used memory constantly increases, this often means there's a memory leak. Based on this concept, this feature greatly simplifies the detection of such situations in e.g. long-running applications such as servers. One of the benefits is that, after being triggered, the feature requires no further human interaction.
To toggle this feature, connect to the profiled application
and press  toolbar button to edit triggers.
Use corresponding template menu to add the trigger and actions, then edit parameters if necessary:
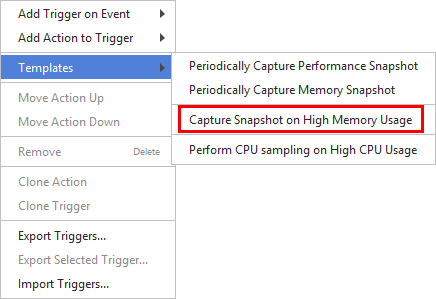
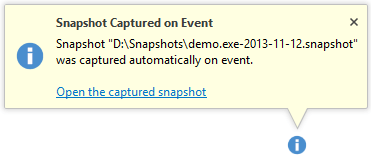
Then, if the threshold is reached, a memory snapshot will be created, a notification will be shown in the UI and the feature will deactivate. You can enable it again afterwards.
How to trigger the snapshots from the start
Use startup option used_mem.