- System requirements
- Account
- How to use broker with Java profiler
- How to use broker with .NET profiler
- Regions
- Zones
- Access tokens
- Collaborators
- Applications
- Application properties
- Migrating account from previous version
How to use broker with Java profiler
This article describes how to use YourKit Connection Broker with YourKit Java Profiler 2024.9 or newer. Please note that all YourKit Java Profiler versions prior to 2024.9 (e.g. 2024.3 and older) do not support connections through the broker.
1. Sign up for YourKit Connection Broker account
Before getting started, you need to sign up for YourKit Connection Broker account. After creating the account, please log into it.
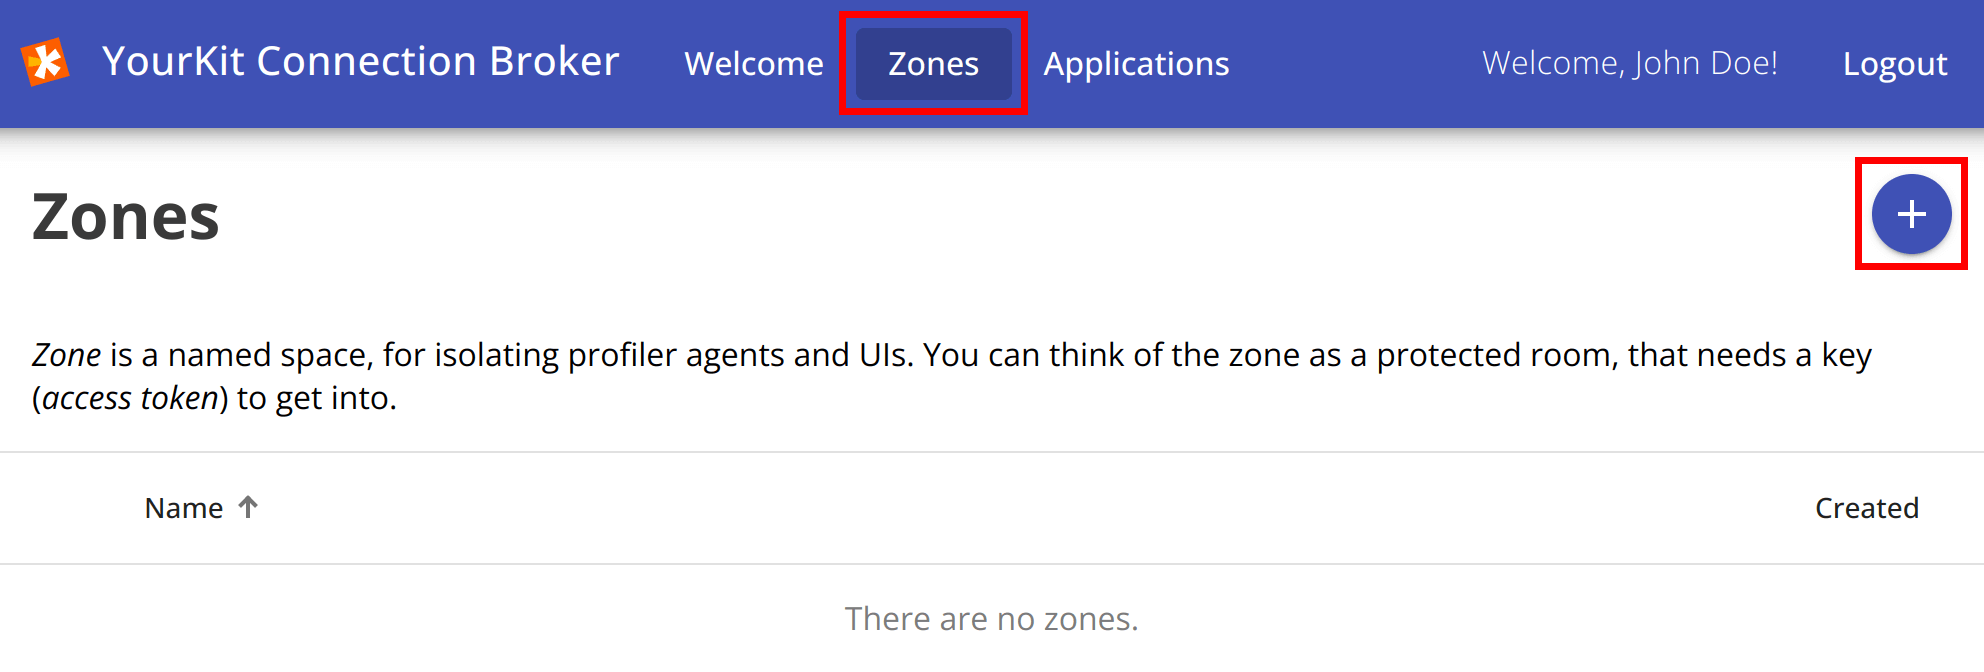
2. Create zone
Navigate to the Zones page and
click  button to create new
zone.
You will need to provide zone name, optional description,
and choose a region that is geographically close to your applications.
Let's create the zone with Demo zone name
in EU -Frankfurt region.
button to create new
zone.
You will need to provide zone name, optional description,
and choose a region that is geographically close to your applications.
Let's create the zone with Demo zone name
in EU -Frankfurt region.
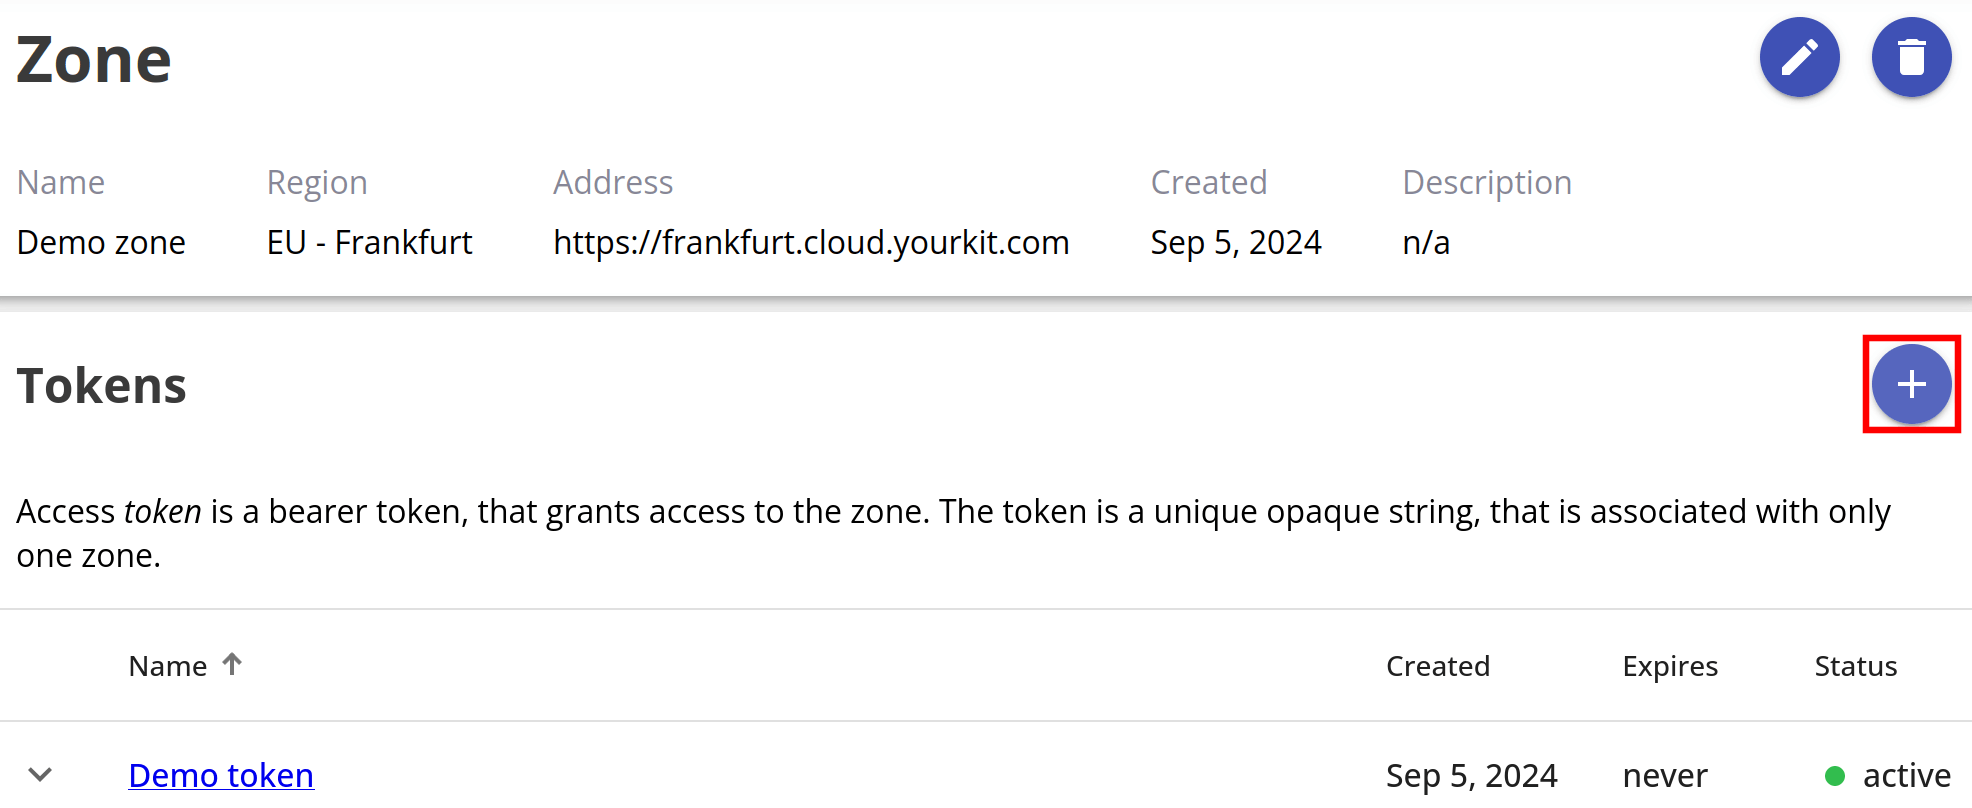
3. Create token
Now we need an access token to get access to the created Demo zone. In this demo, we will create the single token that will be used by both profiler UI and profiler agent. But you may always create separate access tokens.
To create a token, click
button on a Zone page.
Specify Demo token as a token name and click
Create button.
Optionally you may specify token expiration date
if you want to limit its lifespan.
IMPORTANT: Copy the created access token to a safe place, you will need it later. The token is displayed only once after creation. Connection broker does not store tokens as plain text, only hashes, so tokens cannot be recovered.
4. Start profiling
Now you need to add 2 profiler agent startup options:
-
broker_url- Address of the zone, in our case this ishttps://frankfurt.cloud.yourkit.com. -
broker_token- The access token which you have just created.
The full VM option should look like this:
-agentpath:libyjpagent=broker_url=<zone address>,broker_token=<access token>
When you start your Java application with the profiler agent, it will connect to the Connection Broker. You will see your application in the application list.
5. Connect with UI
To connect UI to the application and control profiling, use remote profiling feature:
- On Welcome screen click Profile remote Java server or application...
- Choose YourKit Connection Broker as an application discovery method.
- Specify <broker URL> and <access token>.
- After completing the wizard, a new connection will appear in the Monitor Applications list on Welcome screen.