Application properties
- Application and system properties
- Profiling modes
- Telemetry
- Command line
- VM options
- Environment variables
- System properties
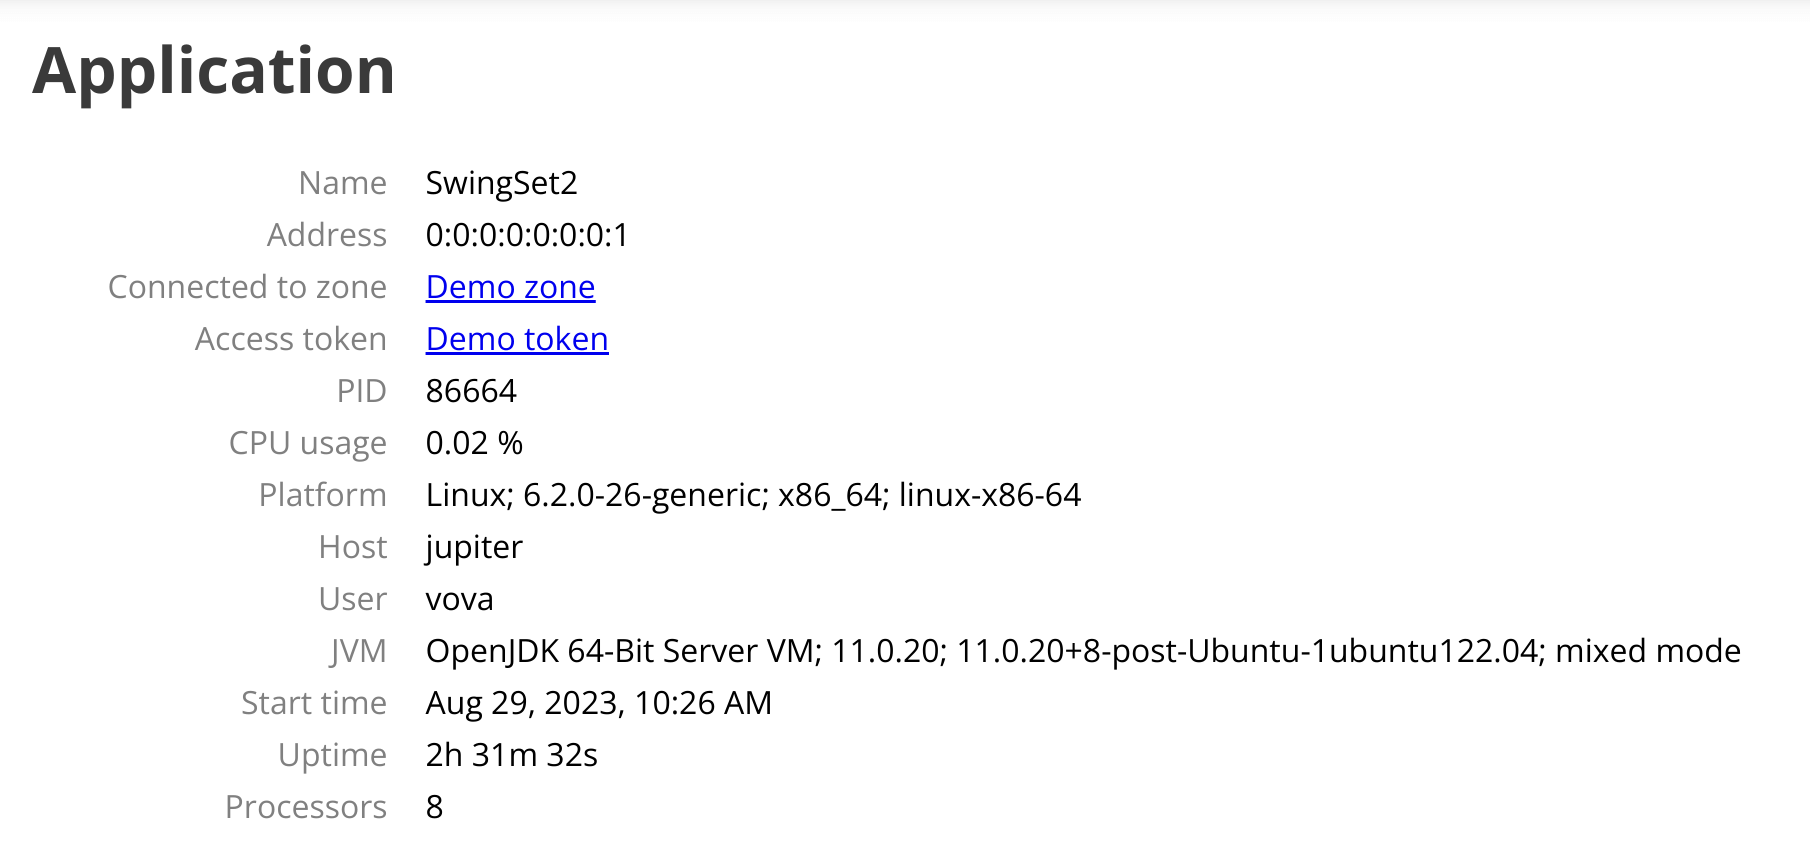
Application and system properties
This section displays various properties of the profiled application and the operating system it runs on.
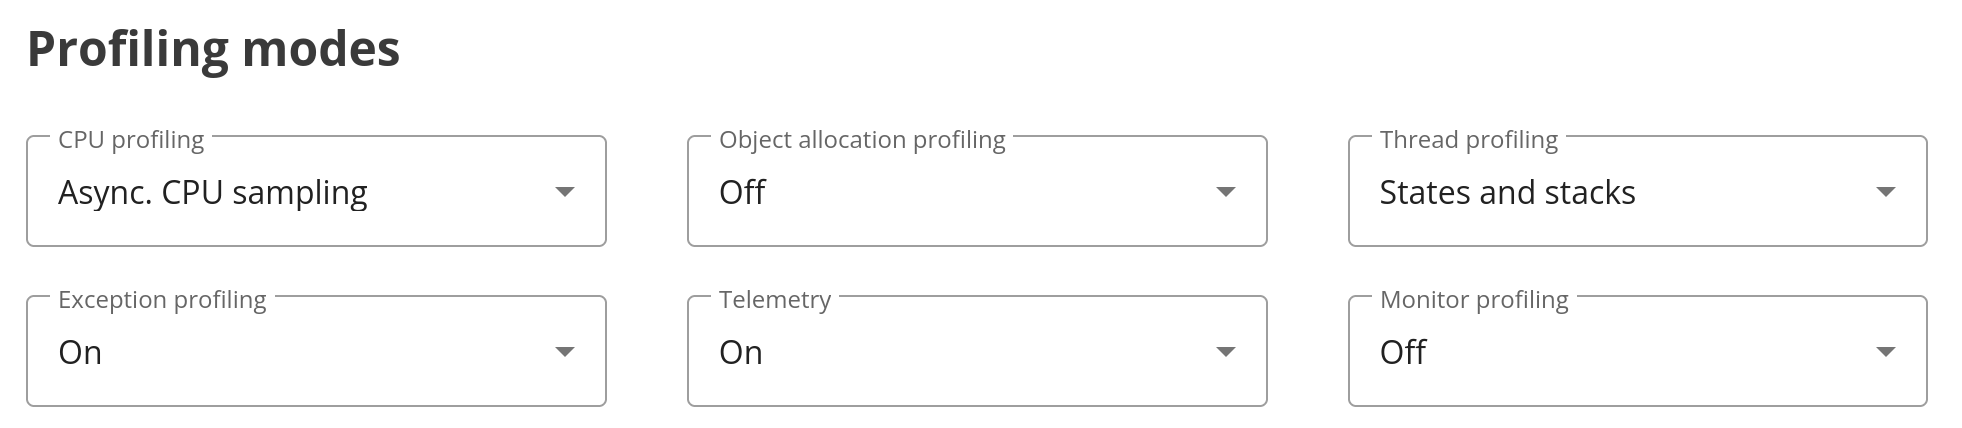
Profiling modes
You can observe and manage profiling modes of your application.
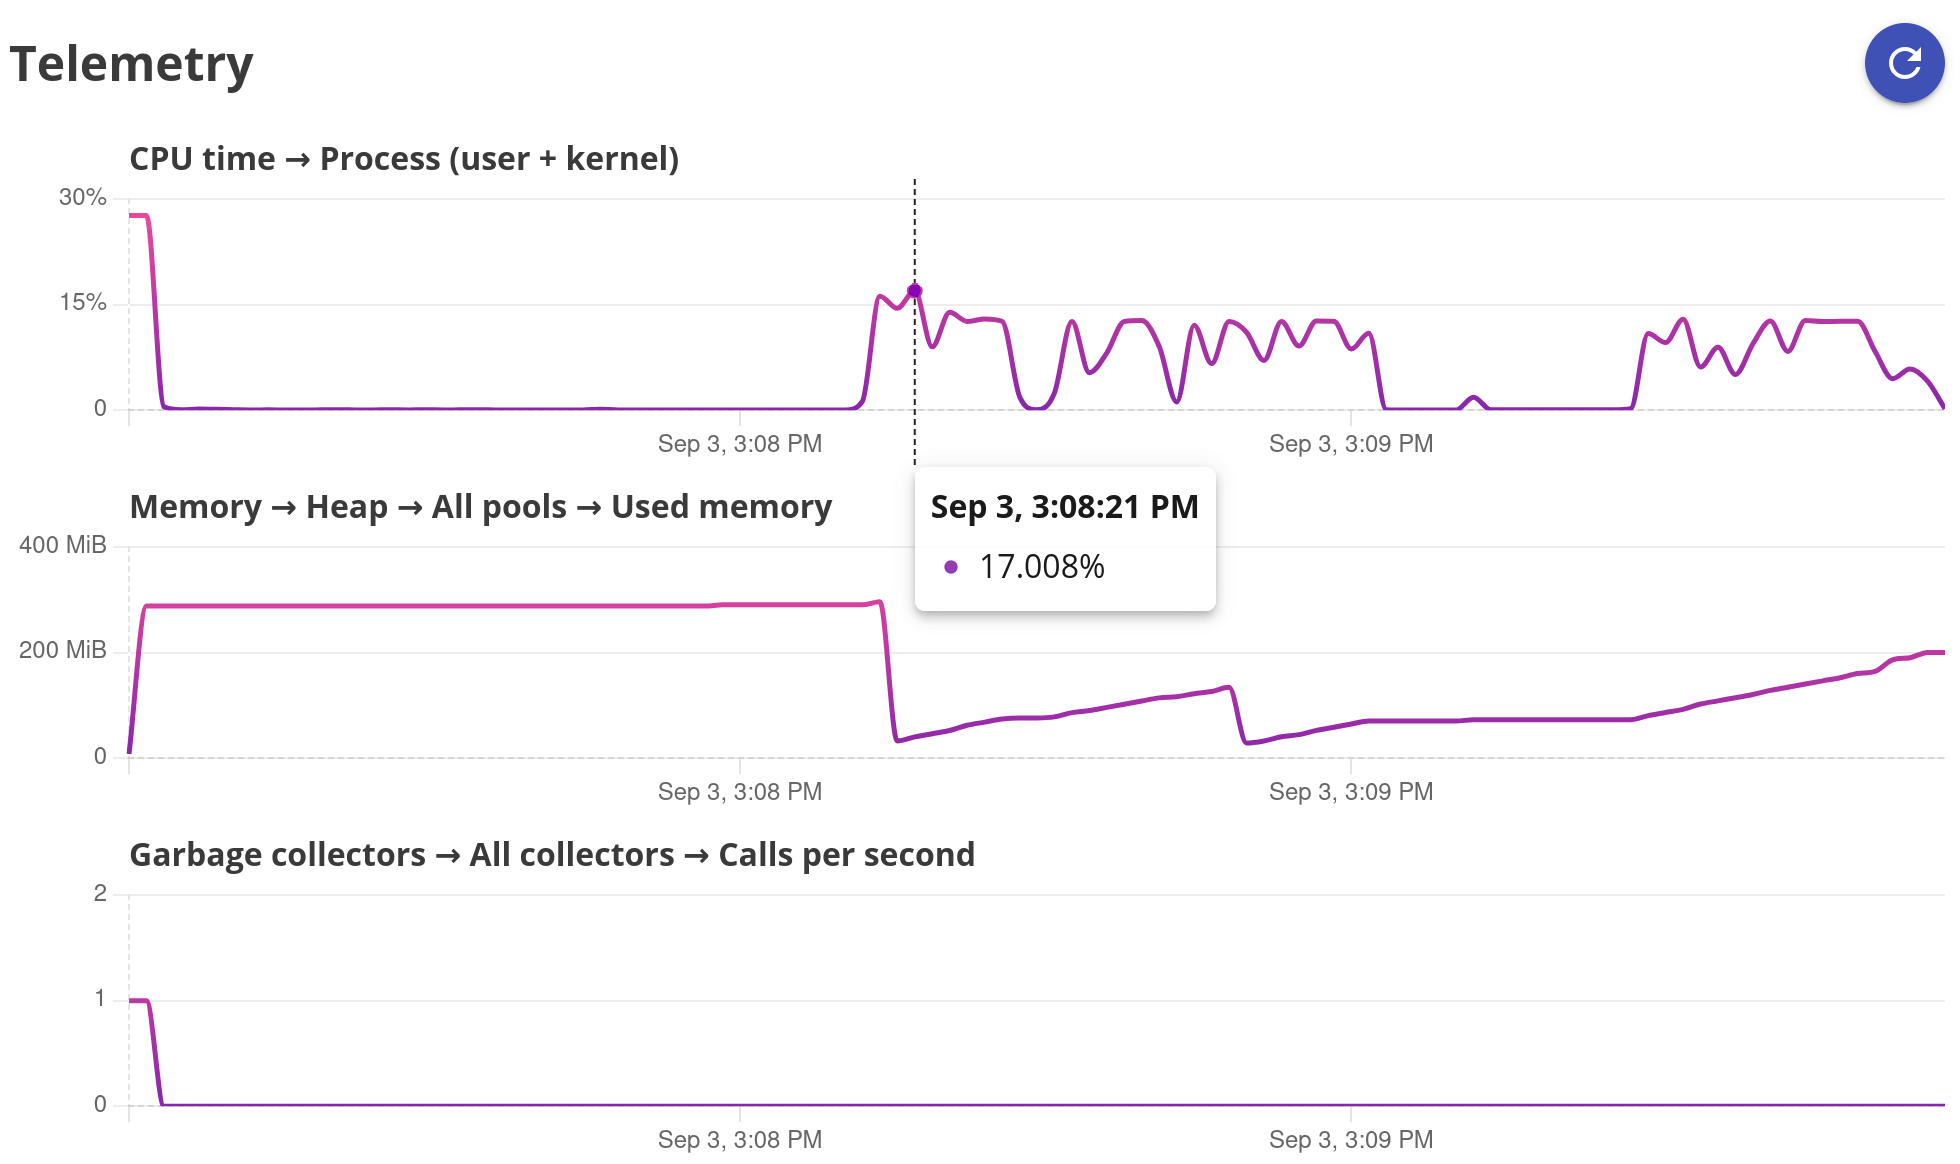
Telemetry
This section displays telemetry charts for CPU, memory, and garbage collector activity.
Command line
Command line section shows full application command line.
VM options
Java specific Section VM option is available for Java applications,
and it displays Java virtual machine options
(such us -classpath, -Xmx, etc.) that were specified in the
command line.
Environment variables
This section displays a list of environment variables. The variables are sorted in alphabetical order, which makes it easy to find the necessary variable.
System properties
Java specific For Java application, section System properties
displays the list properties
(such us java.version, user.home, etc.)
that were used to configure the behavior of a Java Virtual Machine
or your Java application.