Changes in version 2019.1
- JVM support
- CPU profiling
- Memory profiling
- Telemetry
- Event recording with probes
- IDE integration
- User interface
- Miscellaneous
- Deprecations
JVM support
- Java 11 and Java 12 are supported.
- IBM's AdoptOpenJDK.net OpenJDK builds based on the Eclipse OpenJ9 VM as well as on HotSpot are supported. We support the following Java versions available at AdoptOpenJDK.net: Java 8, Java 9, Java 10, Java 11, Java 12.
- Attach mode, i.e. the ability to profile a running JVM instance started without the profiler agent, has been supported for IBM Java based on the Eclipse OpenJ9 VM. This JVM powers the latest IBM Java 8 builds, as well as IBM OpenJDK 8/9/10/11 available at AdoptOpenJDK.net.
- Zulu JDK from Azul is supported.
CPU profiling
- High-level statistics: bug fixed: percents might exceed 100%.
Memory profiling
-
Object allocation recording: added support of the new Java profiling capability called heap sampling, which was introduced in Java 11 via JEP 331. The heap sampling provides a new JVMTI event to record allocated objects without using bytecode instrumentation.
Not instrumenting bytecode for object allocation recording reduces class load time and size of the resulting bytecode.
Also, this new approach is extremely useful in the attach mode, because it totally eliminates the pause on a first attempt to start object allocation recording, which is associated with instrumenting classes loaded before the agent attached.
By default, the heap sampling event is used instead of bytecode instrumentation whenever available, that is, on Java 11 and newer. To use bytecode instrumentation instead, please specify the agent startup option
disable_heap_sampling. -
Memory snapshot opening has been improved: the dominator tree is now by default computed inside the profiler UI process. Previously, an external process would always be launched for the dominator tree computing. The old behavior can be reverted by specifying the property
-Dyk.dc.external-process=truein<user home>/.yjp/ui.ini.The external process approach was introduced many years ago with the intention to support memory snapshot opening in the profiler UI running on a then-mainstream 32-bit JVM having essentially limited address space. Currently, the profiler UI runs on a 64-bit JVM, thus launching the external process no longer makes sense.
Another drawback of the old approach was that some antivirus programs might raise a false alarm for such external process and prevent it from launching, causing the snapshot opening failure.
-
Profiler API: new methods
com.yourkit.api.Controller.getTotalCreatedObjectCount()andcom.yourkit.api.Controller.getTotalCreatedObjectSize()provide basic object allocation recording statistics. The same values can also be obtained with the command line tool's new commandsprint-alloc-object-countandprint-alloc-object-size. -
Command line tool:
new command
start-alloc-recordingstarts object allocation recording with custom record-each and size-limit parameters.
Telemetry
- Bug fixed: stack trace panel does not refresh when thread filter is used.
- Bug fixed: telemetry values might be improperly formatted in non-US locales.
Event recording with probes
-
com.yourkit.probes.builtin.Databasesprobe overhead has been significantly reduced for some loads. - Hibernate version 5.4 is supported.
- EclipseLink version 2.7 is supported.
- OpenJPA version 3.0 is supported.
- MongoDB Synchronous driver version 3.9 is supported.
- MongoDB Async and Reactive Streams drivers are supported.
- HBase Java client version 2.1 is supported.
IDE integration
- IntelliJ IDEA 2019.1 is supported.
- Eclipse 2019-03 supported.
- MyEclipse CI 2018.12 is supported.
- Apache NetBeans 10 and 11 are supported.
- IntelliJ IDEA plugin now uses properly scalable SVG icons when running in IDEA 2018.1 or newer. In older IDEA versions not supporting SVG icons the plugin will keep using bitmap icons.
User interface
- Improved support of HiDPI screens on Linux and Windows.
-
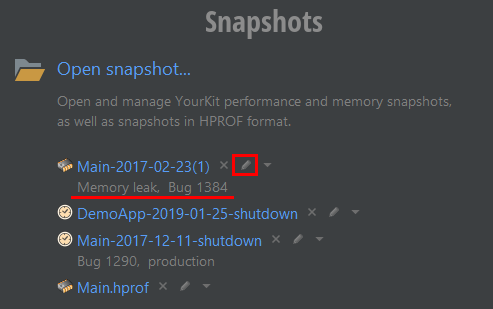
Snapshot annotation, a free form snapshot description,
is now easily accessible in the recent snapshot list, as well as in the "Open Snapshot" dialog.
- Welcome screen: streamlined agent statuses in regard to the agent attachability. A process without the agent loaded is no longer indicated with the "ready to attach" status, because it cannot be reliably determined until attach is actually performed. Instead, the UI now allows an attempt to attach to any process, which will either succeed or show an error message.
- Horizontal scrolling with two fingers gesture now works on Windows.
-
The profiler UI now shows time in 12 hour (AM/PM) or 24 hour format depending on the system settings.
-
"Open Snapshot" dialog now shows and allows to open a snapshot
stored in a GZIP (
.gz) or ZIP (.zip) archive. - Bug fixed: "Open Snapshot" dialog: wrong tooltip position.
- Bug fixed: the monitor profiling live view expanded/collapsed by itself on update.
- Bug fixed: Summary tab: no properties are retrieved for HPROF dumps of Java 10+.
- Bug fixed: permanent, non-closable tooltip in "Threads" view after applying thread name filter.
- Bug fixed: toolbar panel button visual bug on attempt to start CPU tracing or allocations recording if they are disabled.
- Bug fixed: menu separator with text does not look like a separator.
- Bug fixed: expansion states of nodes in Application list on Welcome screen is not saved.
- Bug fixed: profiler UI failed with internal error being started on a machine with invalid font metrics.
Miscellaneous
- The profiler UI now requires a 64-bit JVM to run. The profiler API to programmatically open memory snapshots requires a 64-bit Java too. However, profiling of both 32-bit and 64-bit JVMs is still fully supported, and the console wizards, for Java EE server integration and attach, can run on either 32-bit or 64-bit JVM.
-
Caveat: advanced support level is required on AIX, HP-UX, Solaris, Linux PPC.
According to our statistics, the profiler is rarely used on AIX, HP-UX, Solaris, Linux PPC. However, the ongoing support of these platforms requires significant resources to build, test and maintain, comparable with what it takes to support other, way more popular platforms.
To keep supporting these rare platforms as long as it practicable, we seek to at least a partial compensation from interested users.
Therefore, AIX, HP-UX, Solaris, Linux PPC are now declared advanced platforms. The profiler may run on an advanced platform, a JVM running on an advanced platform may be profiled (i.e. a running JVM may be connected), and results obtained on an advanced platform may be analyzed (i.e. a snapshot of a JVM running on an advanced platform may be opened or exported) only if the license is with the advanced support level.
-
Caveat: snapshot file annotation is no longer offered for
.hprofsnapshots, only for the profiler-format.snapshotfiles. The HPROF format does not allow arbitrary records, and extending a.hproffile with custom records would make it invalid for 3rd party tools. - Local network address resolution has been improved to properly handle machines with misconfigured or absent "localhost" host name.
Deprecations
"Deprecation" means that we intend to remove the feature or capability from a future release of YourKit Java Profiler. The feature or capability will continue to work and is fully supported until it is officially removed.
- Java 6 support.
- Linux support on ARM soft-float architecture, i.e. on ARM chips without hardware floating point unit.