Changes in version 2018.04
- Profiling in Docker container
- Remote profiling
- CPU profiling
- Telemetry
- Java EE integration
- IDE integration
- User interface
- Miscellaneous
Profiling in Docker container
- You can now download dedicated compact bundle containing only files needed in Docker container.
- Agent dependencies on glibc were relaxed, which is important for Alpine Linux based containers.
- New dedicated Help topic provides step by step instructions on how to profile in a container.
Remote profiling
-
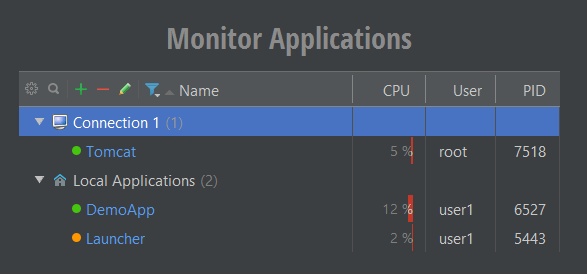
Remote and local applications are displayed together in the "Monitor Applications"
list on Welcome screen. You can monitor CPU usage of remote applications in
real time.
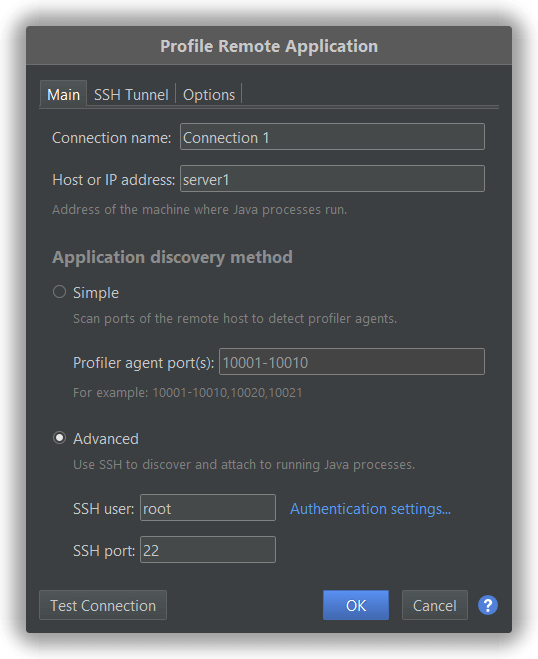
- New Advanced method for secure connection with a remote machine using SSH protocol has been implemented.
-
Added ability to attach the profiler agent to a remote Java process started without the profiler agent
directly from the profiler UI.
-
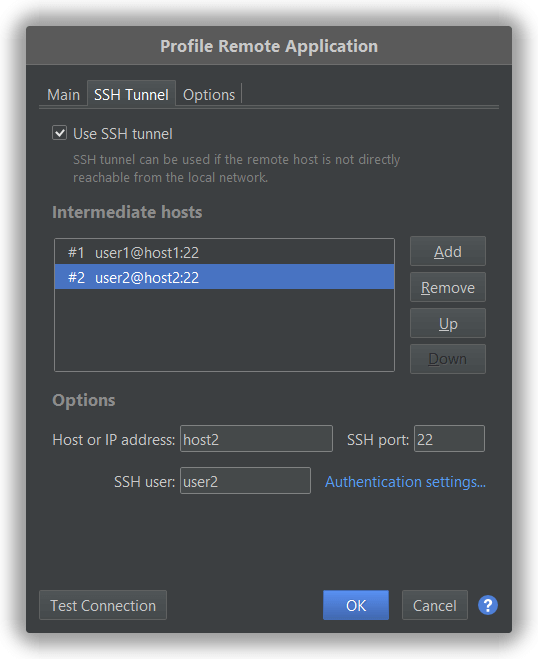
The remote connection dialog allows to set up a multi-hop SSH tunnel through any number of intermediate machines.
-
Due to security reasons the startup option listen has been reworked and accepts now the following values:
Most security, the default option:
listen=localhostbinds the profiler agent socket to localhost only. This will disable a direct remote connection to the agent via <host>:<port>. Connection to the profiler agent will be possible via port forwarding e.g. an SSH tunnel.Easy access:
listen=allopens the profiler agent socket on all network interfaces. A remote connection to the agent will be possible directly via <host>:<port>. Note that access to the port can be additionally restricted with a firewall.Advanced:
listen=<IP or host>binds the profiler agent socket to particular network interface.Please note that
listen=localhostis now the default (the old default was equal tolisten=all), and optiononlylocalis deprecated.Also note that the startup option
portis now the only way to specify the agent port becauselistenno longer duplicates this functionality.
CPU profiling
-
The profiler is now able to open HPROF dumps with CPU samples which are produced
by running
java -agentlib:hprof=cpu=samples,format=b <...>orjava -Xrunhprof:cpu=samples,format=b <...>.
Telemetry
-
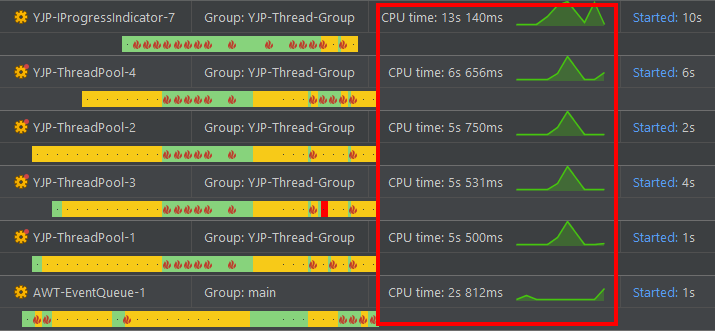
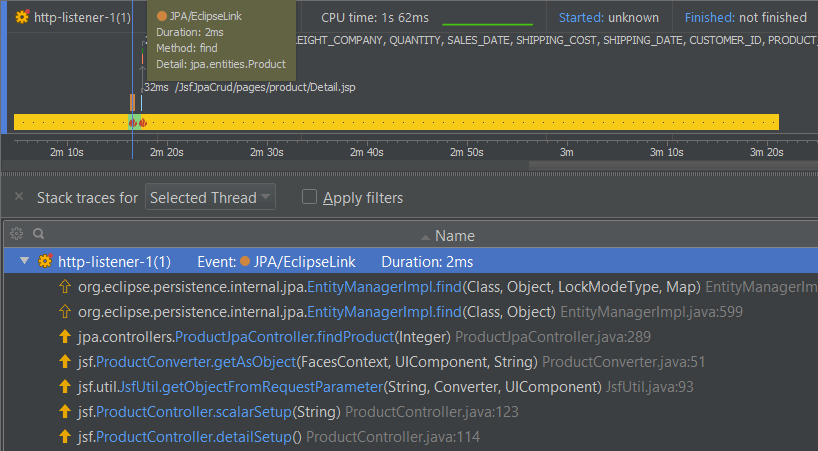
Threads view now shows per-thread CPU usage graphs.
- Thread header elements in Threads view are vertically aligned to improve usability.
-
You can click on particular event in Threads view to see its stack trace.
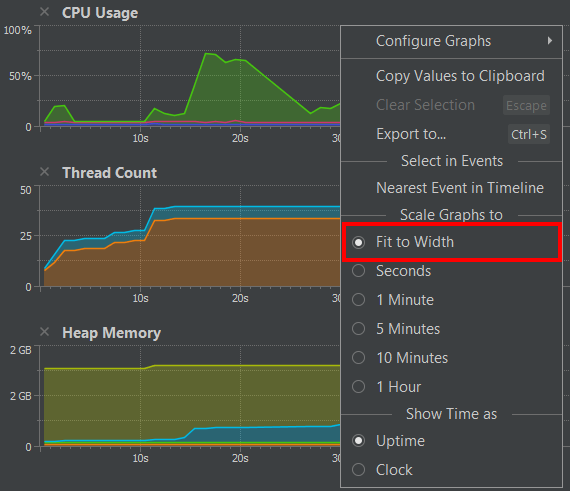
- Threads view now allows to change scale.
-
New "Fit to Width" scaling option has been added in Threads view.
-
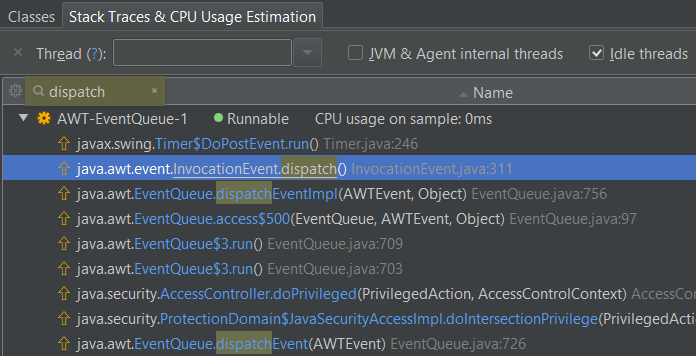
Searchable stacks are in all telemetry views.
Java EE integration
-
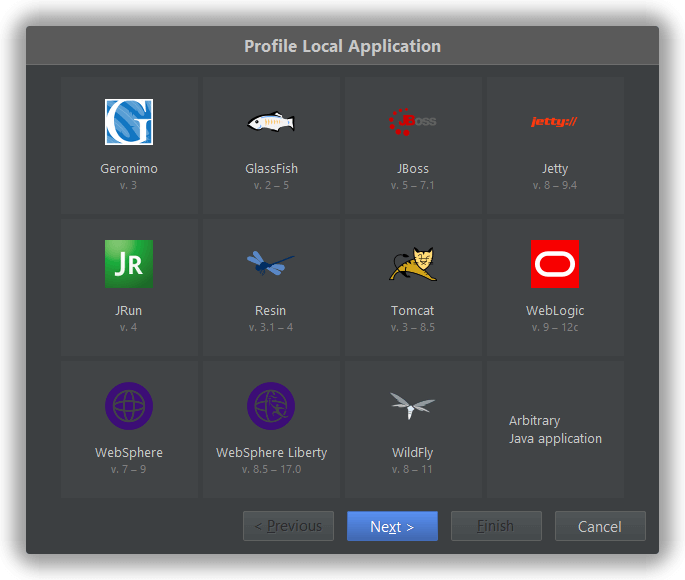
Integration wizard with Java EE servers has been refined and reworked.
New step has been added to reflect new connectivity options.
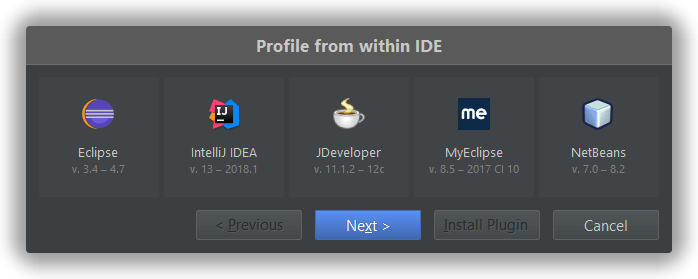
IDE integration
- IntelliJ IDEA 2018 is supported.
-
IDE integration wizard has been reworked. Separate MyEclipse option was added.
- When a newer build is installed, existing IDE integrations are automatically updated to use the newest profiler agents without the user interaction whenever possible. Previously it was always offered to re-run the IDE integration wizard, now the wizard should run only if the plugin and agent changes cannot be applied automatically.
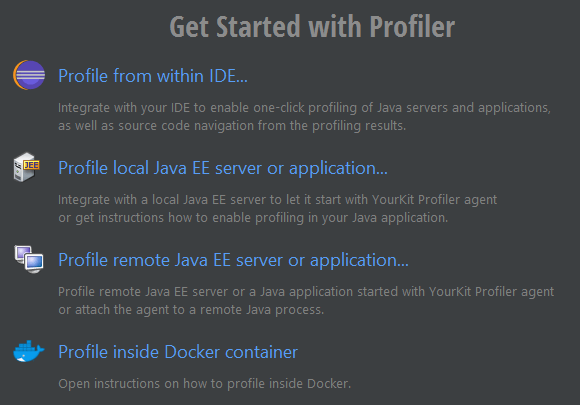
User interface
-
Welcome screen has been refined and reworked. All possible actions enabling different profiling scenarios
are available in one place under the section "Get Started with Profiler".
- Horizontal scrolling is now possible with mouse wheel and two fingers gesture in telemetry graphs and tables.
- Auto-scrolling in tables and in Threads view has been reworked to improve user experience in live profiling sessions.
- Stack trace presentation has been improved in all views, e.g. quick info, deadlocks.
- It is now possible to hide hints.
- On macOS profiler uses on-screen menu bar in Dark theme too.
- JetBrains OpenJDK is bundled to improve UI font rendering quality on macOS and Linux.
- Better filtering of development tools in the "Monitor Applications" section.
Miscellaneous
- Java 10 is supported.
- If the user allows, the profiler now may collect anonymous UI usage statistics to help YourKit improve user experience in future versions.
-
Startup option
portnow allows to specify a port range too. The syntax isport=<min_port>-<max_port>. -
Profiler is now distributed as
.dmgimage for macOS. -
.snapshotfiles are associated with the profiler application on macOS. - Profiler always uses integrated video card instead of switching to the discrete GPU if the machine has multiple GPUs.
- Profiler agent detection was improved on HP-UX.
- Profiler gracefully handles inability to attach to IBM Java. It now shows a user-friendly message on attempt to attach to an IBM Java process started without the agent. This operation is still impossible due to lack of capabilities in IBM Java, and IBM Java can be profiled only by starting with the agent.
-
On Linux, the profiler launcher can easily be found in GNOME or Unity shells.
The profiler now automatically creates
.desktopfiles after its first run. - Bug fixes and performance improvement.