Changes in version 2015
CPU Profiling
-
New feature: Call counting, a lightweight CPU profiling mode.
Call counting is a new CPU profiling mode, which is an alternative to CPU sampling and CPU tracing.
It's a simple tool for identifying potential performance problems caused by suboptimal algorithms. The approach is based on assumption that method(s) with a big number of invocations may indicate a performance problem.

-
It's fast
Call counting is specially designed to have minimal possible, almost zero overhead (see detail below).
-
Available on demand
Just like CPU sampling and CPU tracing, call counting is off by default. You may turn it on from the start using the startup option
call_counting, as well as turn on and off in runtime when necessary. When call counting is on, you may clear collected results. -
Measures invocation counts only
Unlike other CPU profiling modes call counting does not provide stack traces nor method times. Instead, it provides a plain method list with method invocation counts.
-
No per-thread information
Method invocations from different threads are summed and cannot be distinguished.
-
No high-level Java EE statistics
Probes in Auto activity mode are not activated when call counting starts. To get Java EE statistics, please instead use sampling or tracing.
-
Based on bytecode instrumentation for CPU tracing
If you disable CPU tracing with the startup options
disabletracingordisableallcall counting will not be available. -
Not exact: some invocations may be missed
To ensure minimal overhead invocation counts are updated without taking any locks or using test-and-set style atomic operations. As the result, some invocations of the same method happening simultaneously in parallel threads may be missed due to a race condition (non atomic integer value increment). Fortunately, the probability of such events is low, and missed invocations, if any, will normally constitute only a small fraction of all invocations.
Use recommendation: start with call counting, continue with CPU tracing or sampling if necessary.
Use call counting to initially detect possible problems: thanks to its low overhead, you may do this even in production.
Further investigation may involve using CPU tracing or sampling to get comprehensive profiling results with times and stack traces (call tree).
Availability note: call counting is not available in JRockit.
-
-
CPU tracing results now include exact source code line numbers.
Profiling overhead considerations
We decided to enable line number recording by default because, according to our tests, it usually adds almost no extra tracing overhead even in call-intensive applications: the difference is usually less than 5% when CPU tracing is running and even smaller when CPU tracing is not running.
Unfortunately, in some rare cases the extra overhead may be significant (+10% and more). To avoid it you may disable bytecode instrumentation for line number recording by specifying startup option
_tracing_disable_lines(note it starts with an underscore).Availability note: line numbers are not available in JRockit.
-
CPU tracing no longer applies user-defined filters in runtime. Instead, the adaptive tracing mode reduces tracing overhead automatically.
Because CPU tracing was the only profiling mode which applied filters in runtime, the filters are now applied in the UI only across the profiler and their only purpose now is to improve result presentation. It's no longer needed to re-run profiling to apply the filter change in the UI.
- CPU tracing: adaptive tracing is much more efficient now: remaining overhead for excluded methods was dramatically reduced
-
CPU sampling:
default settings have been changed to measure time for
Thread.sleep(*)as wall time, thus making it visible by default -
CPU profiling:
method
System.currentTimeMillis()is now by default instrumented for CPU tracing, and will be visible in CPU tracing and call counting results. Note: this method is intrinsic; if you need to totally eliminate the profiling overhead for its calls, exclude it from instrumentation by using the startup option_skip_currentTimeMillis -
CPU profiling:
if necessary, method
System.nanoTime()can be instrumented for CPU tracing, and will be visible in CPU tracing and call counting results, by using the startup option_with_nanoTime. This method is not instrumented by default because it is intrinsic, and by its nature should provide results as accurate as possible, so any additional overhead is not desired. -
CPU profiling: the range of trivial methods like getters and setters excluded from CPU tracing instrumentation for performance consideration has been extended. Now it includes methods whose bytecode satisfies the following conditions:
- does not exceed 32 bytes;
- does not contain cycles;
- contains only these instructions: load, store and other stack operations, field access, bit and arithmetic operations, comparison operations, return. In particular, this means that these methods cannot call other methods nor create objects.
Note: to force instrumentation of these methods specify startup option
_instrument_all_methods. - UI: "CPU" tab component layout has been unified in live and snapshot modes
- UI: memory footprint of loaded CPU sampling or CPU tracing profiling results has been greatly reduced
- Agent: CPU tracing: lambda related bug fixes
- "Java EE statistics" view: bug fixed: results from the oldest dead threads might not be accounted
-
UI: if CPU tab is visible when CPU profiling starts,
call tree (for sampling, tracing) or method list (for call counting) view is automatically selected.
Now this behavior is optional: to always keep the currently selected view
specify
-Dyjp.auto-select-cpu-view=falsein<Profiler Installation Directory>/bin/ui.ini
Memory Profiling
-
New feature: allocated object counting, a lightweight object allocation recording mode.
Allocated object counting is a new allocation recording mode which is an alternative to the traditional full-featured recording of allocated object stacks and remembering where particular instances were created.

Use this mode to quickly get insight on how many objects are created and of which classes. In particular, this identifies excessive garbage allocation problems (lots of temporary objects).
-
It's fast
Object counting is specially designed to have minimal possible overhead (see detail below). The overhead is negligible in most cases.
-
Available on demand
Just like traditional allocation recording, object counting is off by default. You may turn it on from the start using the startup option
alloc_object_counting, as well as turn on and off in runtime when necessary. -
Counts created objects
Unlike traditional allocation recording, object counting does not provide stack traces and does not track particular instances, i.e. no allocation information for particular live object(s) is available in a memory snapshot.
Instead, this mode provides allocated object counts by class, then by the immediate allocator method with the exact line number, if available.
-
No per-thread information
Objects allocated in different threads are summed and cannot be distinguished.
-
Based on bytecode instrumentation
If you disable allocation recording with the startup options
disableallocordisableallobject counting will not be available. -
Not exact: some allocations may be missed
To ensure minimal overhead allocation counts are updated without taking any locks or using test-and-set style atomic operations. As the result, some allocations of objects of the same class created in the same method simultaneously in parallel threads may be missed due to a race condition (non atomic integer value increment). Fortunately, the probability of such events is low, and missed allocations, if any, will normally constitute only a small fraction of all allocations.
Use object counting to initially detect possible problems: thanks to its low overhead, you may do this even in production.
Further investigation may involve using the traditional allocation recording mode to get comprehensive profiling results with stack traces (call tree).
Availability note: object counting is not available in JRockit.
-
- "Memory" tab component layout has been unified in live and snapshot modes
-
Tab "Garbage Collection" has been replaced with the new tab "Garbage Objects" which is available only in memory snapshots with recorded object allocations, and only if they were in the traditional mode but not with allocated object counting (see below).
Garbage collection telemetry graphs are now located in the "Memory" tab alongside with memory usage and object allocation rate graphs, which makes it easy to correlate all information about the heap.
-
Objects view: improved view link grouping, sorting and naming. In particular:
- the group "Statistics" renamed to "Objects by category"
- "Class list" renamed to "Class" (a category now), "Class tree" to "Class and package"
- views related to object allocation recording are grouped as "Allocations by site" (show where objects were created) and "Allocated objects by life span" (show how long objects lived)
-
Actions Memory | Instances by Class... (Ctrl+N) and
Memory | Class Itself (java.lang.Class) by Name... (Ctrl+Shift+N)
improved:
the pattern is now applied as a substring of the full class name.
In particular this allows you to:
- open inner classes by short name ("Entry" for "Map$Entry")
- specify a name part in the middle, not only a starting prefix ("Map" for "HashMap")
- specify a package ("com.foo.*Wrapper*")
- UI: "Class list" and "Class loaders": camel hump notation support improved in the search field
- Objects view: new view "Shallow size" in the "Objects by category" section has been added to distribute objects by shallow size range. Evaluate how many small, medium and large objects are in the heap, and how much memory they use.
- Objects view: Merged paths view is now available as a dependent view only. To simplify the UI it is no longer added as a left side link in the tabs for object subsets. You still may see merged paths for the tab's entire object set by using the dependent view in Class tree.
-
Object explorer:
optimization:
UI works smoother while showing huge
BigIntegerandBigDecimalvalues -
Object explorer:
bug fixed:
internal error dialog might be shown when browsing
BigIntegerorBigDecimalinstances with invalid values -
Memory | Contained Objects action:
added support of special collection implementation classes
java.util.Collections$SynchronizedCollection,java.util.Collections$UnmodifiableCollection,java.util.Collections$SynchronizedMap,java.util.Collections$UnmodifiableMap - Object allocation recording: streamlined limit logic: allocation is recorded for all objects with size at least X and only for each N-th object of a smaller size
- Object allocation recording: default value of the "Record all objects with the size >=" setting has been reduced from 1 MB to 4 KB (4096 bytes). This change ensures that more objects of potential interest are registered, without increasing profiling overhead in most cases.
- Object allocation recording: garbage collection views in memory snapshot: new column "Avg. GCed Size" shows the average shallow size of collected objects
-
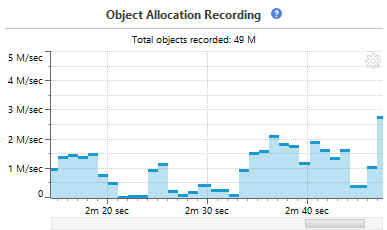
Memory telemetry:
new telemetry graph "Object Allocation Recording" in the "Memory" tab
shows the number of objects created per second when object allocation recording is running
- Memory telemetry: garbage collection counts are now presented on a single graph with an ability to choose what collections to see: minor, major or both (default)
-
Export with command line: for a memory snapshot, values of all
java.lang.Stringsinstances are exported tostrings.txt. This mode is enabled by default; the controlling property name isexport.strings.Export is performed to the text format only, i.e. the
export.txtproperty should be specified if you explicitly specify any of the format properties.To export only strings, use a command line like this (use full paths where necessary):
java -Dexport.strings -Dexport.txt -jar yjp.jar -export foo.snapshot outputDirStrings are exported one per line, with end of line characters quoted as
\nand\r, and the backslash character itself quoted as\\.Objects of all reachability scopes are exported. Duplicates are not eliminated. The output order is unspecified.
Telemetry
- CPU usage estimation: "Samples" column reworked: it now shows in how many time points corresponding stack trace has been registered, in any thread; the value for the top node now presents the number of samples selected. The new approach allows you to estimate how much time the profiled application spends inside particular code branches. (Previous behavior summed stack occurrences in parallel threads, thus making percents less useful.)
- "Stack Traces" tab now shows the clicked point's date in addition to its time of day and uptime, if available
Event Recording with Probes
- Built-in probe Databases and corresponding performance charts: improved handling of Spring framework wrapping connections
-
Built-in probe
Processes: added recording of the process identifier (PID) - Bug fixed: duplicated parent events might have been created for dependent events by built-in probes Files and Sockets
- Bug fixed: false alarm in event inspections "Socket connection opened but not used" and "Files opened but not used"
IDE Integration
- Eclipse: plugin code improvement and cleanup
- Eclipse: support of 3rd party launch configuration types improved (detail)
- Eclipse 4.5 supported (tested with M5)
- MyEclipse 2015 supported
- IntelliJ IDEA 15 EAP supported
- NetBeans 8.1 supported
- JDeveloper: added detection of 32 vs 64-bit Java to automatically choose appropriate agent bitness
- JDeveloper 12c supported
Miscellaneous
- New platform supported: Linux on PowerPC Little-Endian (ppc64le)
- New platform supported: Linux on AArch64
-
UI: new feature: inline search in all tables and trees: click a table or a tree and start typing.
In trees the search works in currently invisible (collapsed) nodes too,
except for those in the object explorer and "Incoming References" because they
are potentially infinite
and in merged callees list and merged paths for performance considerations.

- Welcome screen: added a list of recent remote connections
- IBM Java 8 supported
-
IBM Java: profiling overhead has been significantly reduced.
Caveat: as the result, the following profiling capabilities are no longer enabled by default:
- exception telemetry;
- local variable names in memory snapshots (stacks and threads are not affected).
You may return them (as well as associated overhead) by specifying startup options
_enable_exception_eventsand_with_local_varsrespectively. -
New feature: profiler agent status can be checked by opening
http://localhost:<agent port>for a local profiled application orhttp://<remote host>:<agent port>for a remote profiled application in a web browser. The shown page resembles the content of the Summary tab in the profiler UI plus provides detail on currently active profiling modes. - Agent: bytecode instrumentation optimizations and bug fixes. In particular, the changes solve issues with Groovy classes and classes obfuscated with ProGuard.
-
Agent:
startup option
sessionnamenow allows to use an environment variable value by specifying its name in curly brackets. The default, automatically generated session name can be specified via{default}. For example, to append the host name to the default name, usesessionname={default}-{HOSTNAME}on UNIX andsessionname={default}-{COMPUTERNAME}on Windows. -
Agent:
new startup option
log_sys_timemakes each entry of the agent log file annotated with system date and time, in addition to the process uptime -
Agent:
attach mode:
to reduce the pause on attach that can be observed for some applications (e.g. IntelliJ IDEA),
the built-in probes
JUnitTestsandTestNGare now by default disabled - UI: the profiler UI itself now requires Java 7 or newer to run. Note: profiling of Java 6 applications remains fully supported.
- UI: "Open Snapshot" dialog: new action "Open Containing Folder" opens the snapshot file location in system file manager
-
UI:
"Open Snapshot" dialog:
to improve readability the snapshot file extension
.snapshotis not shown in the table - UI: the dedicated legend component describing non-trivial icons in trees has been removed to save vertical space. Instead, an icon description can be found in its tooltip.
- UI: the demo application launched from the Welcome screen is now started with CPU tracing instead of CPU sampling
- UI: improvement: action File | Extract Performance Snapshot offers to open the resulting snapshot
- UI: automatic update check: the notification that a newer version is available is shown once a day only instead of doing so on each UI start. Note that you can explicitly check for updates using Help | Check for Update.
- UI: bug fixed: race condition could lead to an internal error when capturing a performance snapshot
- Snapshot comparison results tab header now explicitly indicates which of the compared snapshots is the old one (the baseline) and which the new one.
- Deadlock detector: when a deadlock is detected, a new button "Copy to Clipboard" is shown next to "Refresh" to make the functionality easily discoverable. Previously the copy action was available in a popup menu only.
-
If to access the Internet an HTTP proxy is used, you can now specify the proxy settings in the profiler UI.
Note: although the Internet access is not required to use the profiler UI, its availability greatly simplifies installed copy activation with the license key, especially when using floating licenses, as well as enables automatic update checking.
The proxy configuration link is available when you enter the license key, as well as via "Settings | Proxy..." in the main menu.
- Linux distribution: only a 64-bit JRE is now bundled to run the profiler UI. To run the profiler UI on a 32-bit Linux machine you'll need to have a JRE/JDK installed. Note: profiling of either 32 or 64-bit Java applications is still fully supported; this change is only about running the profiler itself.
- Other improvements and bug fixes