Changes in version 2014
- New Feature: Line Numbers
- CPU Profiling
- Memory Profiling
- Telemetry
- Probes
- Triggers
- IDE Integration
- Java EE Integration
- Miscellaneous
- Important fixes and changes in maintenance builds
New Feature: Line Numbers
-
profiling results are presented with exact source code line numbers.

Line number, if available in profiled classes, are shown for:
- CPU sampling;
- object allocation recording;
- stack local GC roots;
- thread stack telemetry;
- thread stacks in HPROF snapshots;
- event stacks;
- exception telemetry;
- monitor profiling.
Known limitation: line numbers have not yet been supported in CPU tracing; this functionality will be added in future versions.
-
IDE integration: Tools | Open in IDE (F7) action can open exact line inside method body in Eclipse, IntelliJ IDEA and NetBeans plugins.
The action can also open exact line in non-Java source code (e.g. Scala), as well field initializers in a Java class.
Known limitation: navigation to line is not available in JDeveloper plugin, it always opens method declaration instead.
CPU Profiling
- Improved UI responsiveness when the profiler is connected to live profiled application
- Scalability improvement: UI works much faster when presenting profiling results for a big number (hundreds or even thousands) of threads
-
UI: improved presentation of methods with time less than 1 millisecond.

Background: the profiler stores measured times with nanosecond precision (however, note that actual accuracy depends on platform and CPU profiling settings), but UI presents them as milliseconds in call tree, method list and other views.
In previous versions, any methods with time greater than 0 but less than 1 millisecond were not shown at all, unless the property
-Dyjp.show.shortest.methods=truewas specified. In that case their time was presented as 0.Now such methods are always (i.e. the property is no longer effective and is ignored if specified) shown with time having one digit after the period, e.g. "0.7" or "< 0.1". The latter means that the time is greater than 0 but less than 0.1 millisecond.
-
Java EE high-level statistics view: added support of
executeBatch() - Java EE high-level statistics view: other improvements, bug fixes
- CPU tracing: adaptive tracing parameter "adaptive_min_tracing_duration_ms" has been dropped as redundant
- Bug fixed: snapshots with certain EE profiling data failed opening
-
Bug fixed:
CPU tracing in attach mode:
some method invocations might have been lost under certain circumstances
in case of exceptions thrown in classes from
java.langand some other packages
Memory Profiling
-
Memory snapshots are opened faster and require less memory to load thanks to:
- significantly improved dominator tree computing, which is the most time and memory intensive part of a memory snapshot loading;
- improved algorithms of web application processing;
- new snapshot format (note: snapshots from older versions still can be opened);
- many other improvements and optimizations.
- Snapshot capture takes less time in some cases
- UI: memory snapshot capture progress advances more smoothly
- Usability improvement: 64-bit HPROF snapshots with compressed object pointers are now detected automatically, without user interaction
-
Usability improvement:
Android HPROF snapshots can be loaded directly;
it's no longer needed to manually convert them to the standard format with
hprof-convbefore opening -
New feature:
the profiler format
.snapshotfile can be converted to HPROF binary format. -
Object allocation recording: garbage statistics is now always collected per class thanks to optimizations which eliminated additional overhead of this mode.
Startup option
noperclassgchas been deprecated, it has no effect anymore and is ignored if specified.API method
Controller.startAllocationRecording()signature didn't change for compatibility, but the parameterboolean perClassGarbagehas no effect anymore, its value is ignored. - Object explorer: float values are shown without intermediate conversion to double, which might result in showing "noise" digits beyond the float data type precision
-
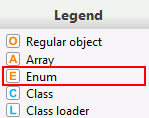
Object explorer: enum values are now marked with a special icon:
-
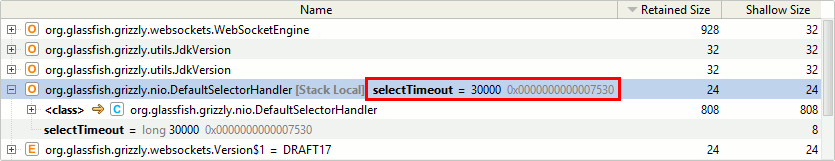
Object explorer:
class-specific object presentation:
if a class has only one instance field, and the field is primitive,
its value is immediately shown for the class instances
- Object explorer: class-specific object presentation: enum value names are immediately shown
-
Object explorer:
class-specific object presentation:
hash map chunk sizes are shown - see elements of the array referenced from the
tablefield -
Object explorer:
class-specific object presentation:
added support of
java.util.UUID -
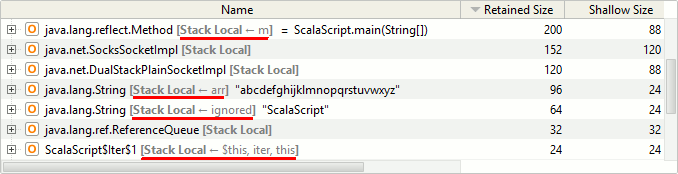
Object explorer:
if an object is a root of type "Stack Local", a list of corresponding local variable names is shown directly.
Hint: the root detail such as thread and variable position in stack can be seen in Quick Info.
-
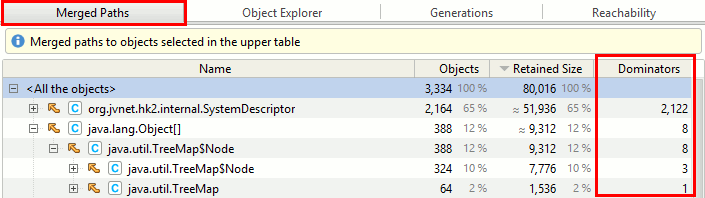
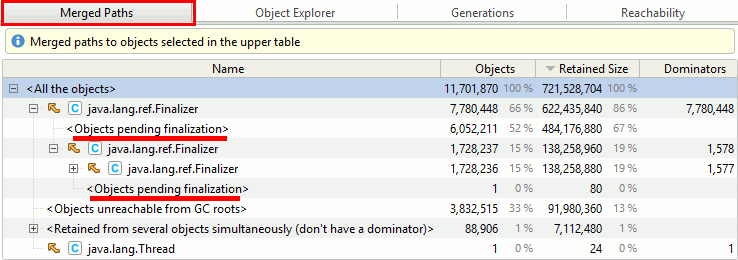
Merged paths:
improvement:
in addition to existing column "Objects" showing the number of target objects
which belong to particular path, a new column "Dominators" has been added to show the number
of objects retaining those target objects.
These dominators can be opened by using the popup menu action "Selection dominators".
-
Merged paths:
objects pending finalization are explicitly indicated
- Reachability scopes: "Objects pending finalization" scope is now also available for IBM Java snapshots
- UI: object views performance improved
- UI: Garbage Collection -> (Statistics) Class list -> Object ages: bug fixed: existing object statistics does not respect selection in the upper table
- New action Memory | Contained Objects supersedes previously existed Memory | Array Elements and opens all objects contained in selected arrays, collections and maps; for maps it offers to open keys only, values only, keys and values, or map entry objects. Please note the action also works on the head element of each map chunk, opening elements in this particular chunk only, which is useful for hash code distribution analysis.
- Memory | Strings by Pattern... (Ctrl+F) action now allows you to choose between simplified and full regex pattern syntax
-
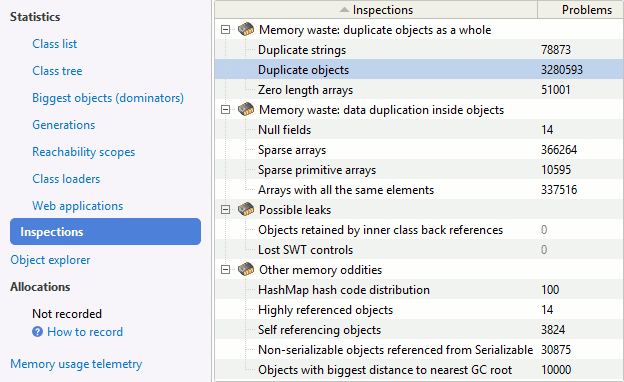
Memory inspections re-grouped, sets of options streamlined
-
Memory inspections:
new inspection Duplicate objects finds identical objects and arrays wasting memory.
It supersedes the previously existed inspection "Duplicate arrays" which worked with arrays only.

- Memory inspections: "Highly referenced objects": result presentation improved: maximum reference count among class instances is shown for class grouping nodes
- Memory inspections: "HashMap hash code distribution": Java 8 supported
-
Memory inspections:
"HashMap hash code distribution":
added support of
WeakHashMap,HashTable,ConcurrentHashMap - Memory inspections: "Duplicate strings" works faster
- Memory inspections: "Duplicate strings": bug fixed: the inspection might provide no results for snapshots captured in attach mode
- Bug fixed: some field values were not written in IBM Java memory snapshots
Telemetry
- Performance Charts: overhead reduced
-
Performance Charts:
the default activity mode of underlying probes
probe_disable=com.yourkit.probes.builtin.*LWhas been changed from Auto to On, thus making the results available even when CPU profiling is not running - Performance Charts: Databases: Statement and PreparedStatement calls are shown separately, new graphs added to show statement open/close rate and duration
-
Performance Charts:
bug fixed: connections created with
Driver.connect()might be skipped -
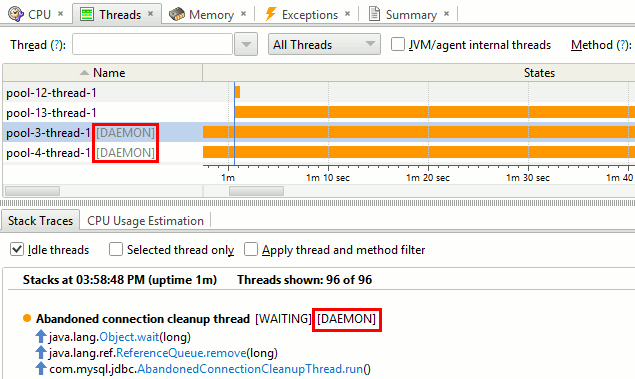
Daemon threads are indicated in Threads view and stack traces
-
Snapshot comparison: new feature: per-class object counts and sizes are now compared for performance snapshots too; the numbers to compare are taken from the class instance count telemetry in memory telemetry.
Note: the reachability scope of objects to compare can be chosen only when comparing two memory snapshots. If at least one of the snapshots is a performance snapshot, objects of all reachability scopes (i.e. all existing objects) are taken into account.
- Threads view: CPU usage estimation: new option "Selected thread only"
- Bug fixed: telemetry started approximately 1 second (i.e. one telemetry period) later
- Memory telemetry: bug fixed: limit 0 was shown for memory pools with unknown limit
Probes
- Probe overhead reduced
-
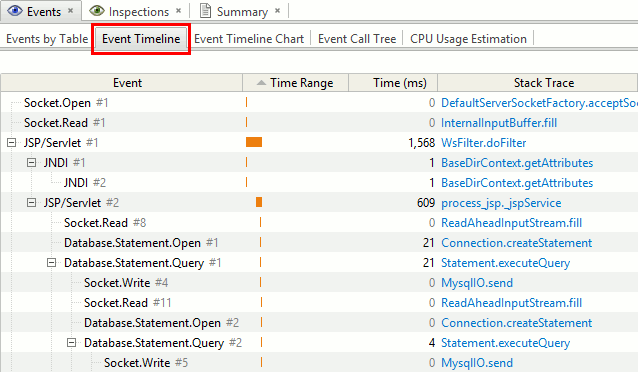
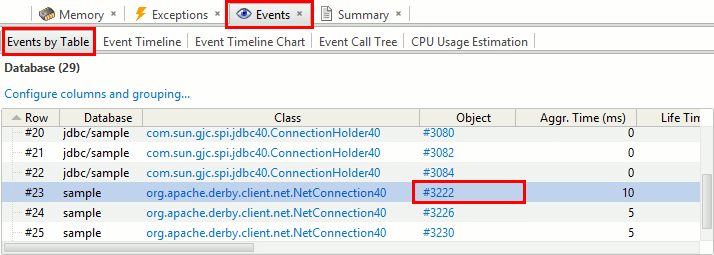
UI: the probe results are now shown in the tab named "Events" (the old name was "Probes"):

-
New feature: Event Timeline Chart view has been added to graphically present event sequence. It is complementary to the existing Event Timeline view showing event sequence in a table form.

-
Event Timeline view reworked:
- nested events are now shown as tree nodes;
- column cleanup;
- new "Time (ms)" column shows event duration;
- new columns to explicitly show event thread and stack, if available;
- new popup menu actions.
- UI: on attempt to open in Event Timeline an event from an excluded table the profiler now offers to include it automatically, thus significantly improving usability
-
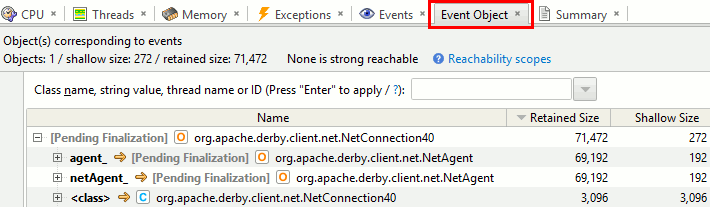
UI:
objects associated with events can be opened in object explorer by clicking the link in "Object" column,
if they still exist, i.e. have not yet been collected.
This feature is available for memory snapshots only.
-
Event capacity limit is now applied to the event count in each top level table (e.g. "File" and "Database") together with all events in its dependent tables (e.g. "Read" and "Query"). This removes result inconsistency by eliminating partially recorded events. The default limit has been increased to 100,000 events (customizable with the agent startup option
probetablelengthlimit).Tables that reached the limit are indicated in the UI.
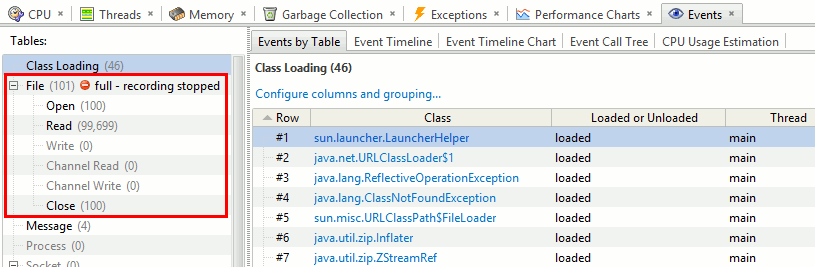
Hint: to record new events clear the full table with "Clear..."
-
If a lasting event ends on exception, the exception detail can be stored and presented in the UI.
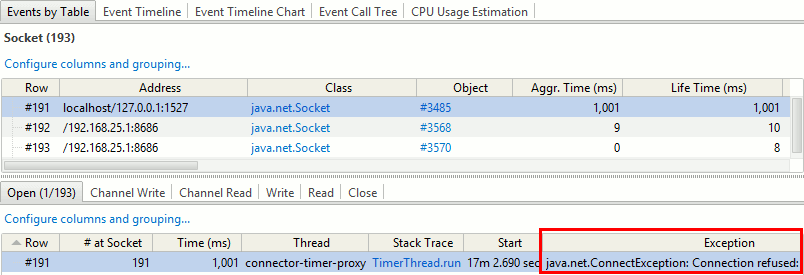
Probe API: this new functionality is implemented with a new method
com.yourkit.probes.Table.closeRow(int row, @Nullable Throwable exception). CallingTable.closeRow(row)is the same asTable.closeRow(row, null). - Built-in probes: some tables were given shorter names to improve readability in the UI
- Servlets: bug fixed: events corresponding to method calls which failed on exception were never closed
- Databases: added handling of connections created when the probe was inactive. Note: the probe's default activity mode is Auto, thus the probe is inactive until CPU profiling is started.
- Databases: bug fixed: events corresponding to method calls which failed on exception were never closed
-
Databases:
bug fixed: connections created with
Driver.connect()might be skipped -
Files:
added support of the standard streams
System.in,System.outandSystem.err - Files: added handling of files opened when the probe was inactive. Note: the probe's default activity mode is Auto, thus the probe is inactive until CPU profiling is started.
- Files: all file I/O operations are now presented in a single table "File I/O"; new column "Class" was added to easily help identifying file input streams, file output streams and random access files
-
Sockets:
bug fixed: possible
java.lang.NullPointerException -
Threads:
new dependent table
Runrecords time span ofThread.run(); if the method throws an uncaught exception it will be recorded - Class loading probe: caveat: events are not recorded for core classes loaded during JVM initialization to avoid a race condition which might lead to a crash on startup
-
Reworked and simplified event model. Each single event now corresponding to only one method call. Resources such as files or sockets which can be created, used and eventually closed in different methods and event threads are now handled as such:
- resource opening event is stored in a master table
- resource operations (e.g. reads, writes) are stored in dependent tables
- resource close event is also stored in a dependent table "Close"
This change simplifies and improves event presentation in time-line views, event correlation/intersection, measures open and close durations by themselves, as well as gives the following new time metrics:
- event own time, which is the duration of a lasting event by itself (example: the duration of a resource-opening operation)
- event aggregate time, which is its own time summed with own times of all dependent events, recursively (example: total time of all operations with the resource: open, read, write, close)
- event life time, which is the time span between event start time and one of the following points, whichever comes last: event end time, or latest end time of dependent events, recursively (example: for how long the resource was in use, from open to close)
- Improved and streamlined support of resource-like entities such as files, database connections and statements. The resource itself is presented with a master table, and related events such as open, read, write, query, close are presented in a dependent table, i.e. at the same level. Previously, the open event was merged with the resource itself, while all other events including close located in a dependent table, which was difficult to interpret and process.
-
API:
new callback
onExitcan be used instead of two separate callbacksonReturnandonUncaughtException. It helps avoiding code duplication in when a lasting event created inonEntershould be closed on normal return as well as on exception. See source code of built-in probes as its usage example. -
API:
new column class
com.yourkit.probes.ObjectColumnis intended to record a persistent object ID, allowing to associate a memory snapshot's objects with events. Examples of use: resources in built-in probes such as database and file objects; objects whose method calls were recorded with the trigger action "Record Method Invocation". -
API: to simplify writing a single probe handling a family of methods with different parameter or return types,
@Paramand@ReturnValueannotations now allow to use a "bigger" primitive type to store "smaller" values:intcan storebyte,short,charlongcan storebyte,short,char,intdoublecan storefloat
For example, if there are two methods
int read(X)andlong read(Y), a single probe with a long parameter annotated with@ReturnValuecan be written. Previously, it was required to write 2 different probes, one for the method returningintand another for the method returninglong, or use an Object to wrap the value. -
API: caveat: a number of
com.yourkit.probes.Tablemethods and constants were removed:-
setFrequentSamplingThreshold()removed; use the startup option telemetryperiod instead -
isRowClosed()removed as redundant and non-complying with the synchronization-related optimizations described above. Instead, rows remaining opened should be explicitly stored in a container likeHashSet. See the source code of the built-in probeProcessesfor example. -
MASK_FOR_GENERIC_LASTING_EVENTSandMASK_FOR_SINGLE_METHOD_CALL_LASTING_EVENTSremoved - see the notes about the probe model change above; use the new constantMASK_FOR_LASTING_EVENTSinstead
-
- Bug fixed: stack traces of events recorded during CPU tracing were missing the top method
- Event inspections: bug fixes
- Agent: bug fixed: class verification error for custom probes under certain circumstances
Triggers
-
New action "Alarm" provides an ability to show a notification in the profiler UI when particular event happens, e.g. when memory usage reaches a threshold or CPU usage is high for some period of time.
"Alarm" action is similar to "PrintMessage" action, it also allows you to specify a free form text message with macros which will be written to the "Messages" table.
When the profiler connected to a running application detects such alarm message, it shows a notification pop up.
-
Method invocation: "Record Method Invocation" action improved:
- to improve sorting and grouping capabilities, new columns "Class" and "Method Name" were added
- the object for which the method was called ('this') is recorded and can be opened if a memory snapshot is captured
-
Snapshot file name macros are now surrounded with
{and}instead of<and>to simplify specification of the new startup optionsnapshot_name_format=<format>in command line, because<and>mean stream redirection in most command shells and must be escaped -
Snapshot file name macro
{pid}was added
IDE Integration
- Navigation action was renamed to "Open in IDE" in the profiler UI
-
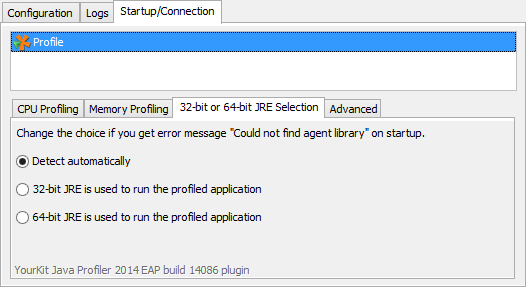
32-bit vs 64-bit JRE plugin settings now offer 3 options:
- detect bitness automatically (default);
- force using 32-bit JRE;
- force using 64-bit JRE.
- Eclipse plugin is now digitally signed, preventing unsigned content warning on installation
- IntelliJ IDEA: Tools | Open in IDE (F7) action feedback improved: on success, IntelliJ IDEA icon flashes on Windows and jumps on Mac OS X to draw user attention
- IntelliJ IDEA: to avoid unnecessary changes in project files, the default profiling settings are stored as an empty XML element
- NetBeans: bug fixed: navigation to source code might not work in Deadlock detector
-
Tools | Open in IDE (F7) action: improved and streamlined
The action "Open in IDE (F7)" now always acts immediately, without showing the target chooser popup. In case of two available targets it opens the primary one. The second target can be opened with a new action "Open in IDE (Alternate) (F8)". For convenience, the shortcut F8 works in case of a single target too, doing the same as F7 would do.
Both actions, when seen in a menu, now explicitly show the navigation target for current context, making it obvious what they will do.
Also, primitive types (
int,charetc.) are never offered for opening because no IDE can do anything meaningful for them - Bug fixed: "Open in IDE" action might not navigate to a method having a variadic parameter
- Bug fixed: Tools | Open in IDE (F7) action: success notification popup was not shown in some contexts
- Bug fixed: Tools | Open in IDE (F7) action: navigation to some methods with generic parameters did not work
Java EE Integration
- Java EE integration wizard: Tomcat 8 supported
Miscellaneous
-
Agent:
new synchronization mechanism
significantly reduces overhead when profiling multithreaded applications.
In particular, this improvement affects:
- CPU tracing
- probes
- object allocation recording
- monitor profiling
- exception telemetry
-
Agent:
new startup option
snapshot_name_format=<format>enables snapshot file name customization - Agent: IBM Java 7 Release 1 supported
- Agent: FreeBSD: attach mode supported
- Agent: problem solved: Java 8 and newer might crash when starting CPU tracing or object allocation recording in attach mode, if profiled application used Java 8 lambdas
-
Agent:
force GC action now uses a JVMTI call instead of
System.gc()to let it work even if-XX:+DisableExplicitGCis specified. For the old behavior use the agent startup option_no_jvmti_gc. - Agent: bytecode instrumentation bug fixes
- Agent: bug fixed: some class names in monitor and exception profiling results might be incorrect under certain rare conditions
- Agent: bug fixed: attempt to attach the agent to a running IBM JVM might crash it. Note: the attach mode is not supported for IBM Java (and never was), IBM Java should be started with the profiler agent instead. This fix prevents an attempt to attach which is technically possible but results in an internal JVM crash.
- Remote profiling: reduced overhead of connecting the profiler UI to a remote profiling application. The agent is no longer blocked until all data is transferred to the profiler UI on each update, which might cause performance issues in case of slow network connections.
-
Remote profiling: "Connect to Remote Application" dialog now offers a built-in support for SSH tunneling. Authentication with a password or a private key is supported. Read more...
- UI: improvement: connect to profiled applications and opening snapshots is now faster thanks to lazy construction of some heavy components
-
UI:
inspections UI layout has been changed to use available space more effectively

-
UI:
Mac:
Dark color theme support added on Mac OS X.
To switch the theme use corresponding main menu items under
Settings. Known issue: the main menu is inside the frame. -
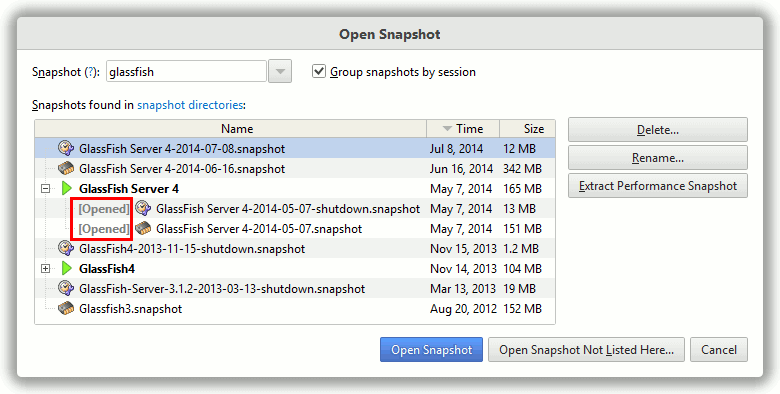
UI: "Open Snapshot" dialog: improved handling of already opened snapshots:
- opened snapshots are explicitly indicated in the list;
- applying the "Open Snapshot" action to an opened snapshot now navigates to the snapshot tab and closes the dialog window instead of showing a message that the action is not applicable.
-
UI: capture snapshot dialog: new snapshot file name macro
{pid} - UI: Export: the file chooser dialog remembers the previously chosen output format
- UI: tables and trees performance improved
-
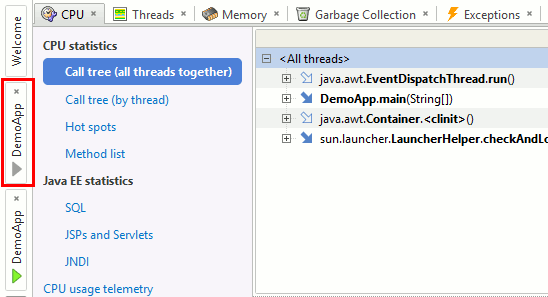
UI:
indication of terminated and disconnected sessions improved:
when profiled application terminates or disconnects, its tab's icon is grayed
- UI: bug fixed: excluded by adaptive CPU tracing method marks were shown in non-CPU profiling views too
- Windows: the installer and the profiler executable files are now digitally signed
- Mac: the application is now digitally signed, and is no longer blocked by Gatekeeper in its default mode "Allow applications downloaded from: Mac App Store and identified developers"
- UI: Mac: bug fixed: poorly visible (black) text in a selected row in some tables
-
UI: Mac: bug fixed: possible
java.lang.ArrayIndexOutOfBoundsExceptionwhen plugging an additional display - Export: plain lists are exported to text more compactly, without intermediate empty lines and tree node markers
- Export: bug fixed: export to text might improperly align text inside column
Important fixes and changes in maintenance builds
-
IDE integration:
Eclipse plugin now exports package
com.yourkit.eclipse34Pluginto allow tool developers providing custom launch configuration types enable their profiling. See the original request. - IDE integration: IntelliJ IDEA: special handling of profiling settings stored with older versions of the plugin has been added to avoid unnecessary changes in project files
-
IDE integration: the action "Open in IDE (F7)" now always acts immediately, without showing the target chooser popup. In case of two available targets it opens the primary one. The second target can be opened with a new action "Open in IDE (Alternate) (F8)". For convenience, the shortcut F8 works in case of a single target too, doing the same as F7 would do.
Both actions, when seen in a menu, now explicitly show the navigation target for current context, making it obvious what they will do.
Also, primitive types (
int,charetc.) are never offered for opening because no IDE can do anything meaningful for them -
Agent:
added ability to prevent bytecode instrumentation of particular classes and methods
by specifying their patterns in a config file
~/.yjp/bci_filter.txt. The pattern format is the same as for the filters. The file does not exist by default, create it if necessary. To specify several patterns please put one pattern per line. -
Bug fixed: the profiler might fail to attach the agent to a running JVM in some rare cases
-
CPU profiling:
Thread.sleep()was removed from the "zero-time methods" list and will no longer be excluded by default from the profiling results. If you want to exclude it please use the "What-if" feature. -
Memory profiling:
object explorer:
class-specific object presentation:
the path is immediately shown, if available, for
java.io.RandomAccessFile,java.io.FileInputStream,java.io.FileOutputStream,sun.nio.ch.FileChannelImpl -
Memory profiling:
"HashMap hash code distribution" inspection:
added support of
ConcurrentHashMap -
Memory profiling:
action
Memory | Contained Objects: more collection and map classes supported -
Memory profiling:
object explorer:
class-specific object presentation:
hash map chunk sizes are shown - see elements of the array referenced from the
tablefield -
Memory profiling:
new action
Memory | Contained Objectssupersedes previously existedMemory | Array Elementsand opens all objects contained in selected arrays, collections and maps; for maps it offers to open keys only, values only, keys and values, or map entry objects. Please note the action also works on the head element of each map chunk, opening elements in this particular chunk only, which is useful for hash code distribution analysis. -
Memory profiling:
"HashMap hash code distribution" inspection:
added support of
WeakHashMapandHashTable -
Triggers: new action "Alarm" provides an ability to show a notification in the profiler UI when particular event happens, e.g. when memory usage reaches a threshold or CPU usage is high for some period of time.
"Alarm" action is similar to "PrintMessage" action: you also specify a free form text message with macros to be written to the "Messages" table.
When the profiler connected to a running application detects the alarm message, it shows a notification pop up.
- Triggers: if triggers are specified on startup and each time the trigger configuration changes in runtime an event is added to the "Messages" table in the "Events" tab
-
Serviceability (non-Windows only):
to simplify support case investigation,
a HotSpot JVM crash log file
hs_err_pid, if created in a standard location, is automatically copied to the profiler agent log file directory~/.yjp/log