Changes in version 2025.3
- JVM support
- Alpine Linux support
- macOS support
- Networking
- User interface
- CPU profiling
- Thread profiling
- Memory profiling
- Object allocation profiling
- Exception profiling
- Monitor profiling
- Telemetry
- IDE integration
- EE server support
- Triggers
JVM support
- feature Java 24 is supported.
Alpine Linux support
-
caveat
Minimal supported version of
muslC standard library is now 1.2.4.
macOS support
- improvement Version and dashes were removed from the macOS application name. The app is now always called YourKit Java Profiler, following macOS naming guidelines.
- fix Profiler may not start if the installation directory contains spaces.
Networking
-
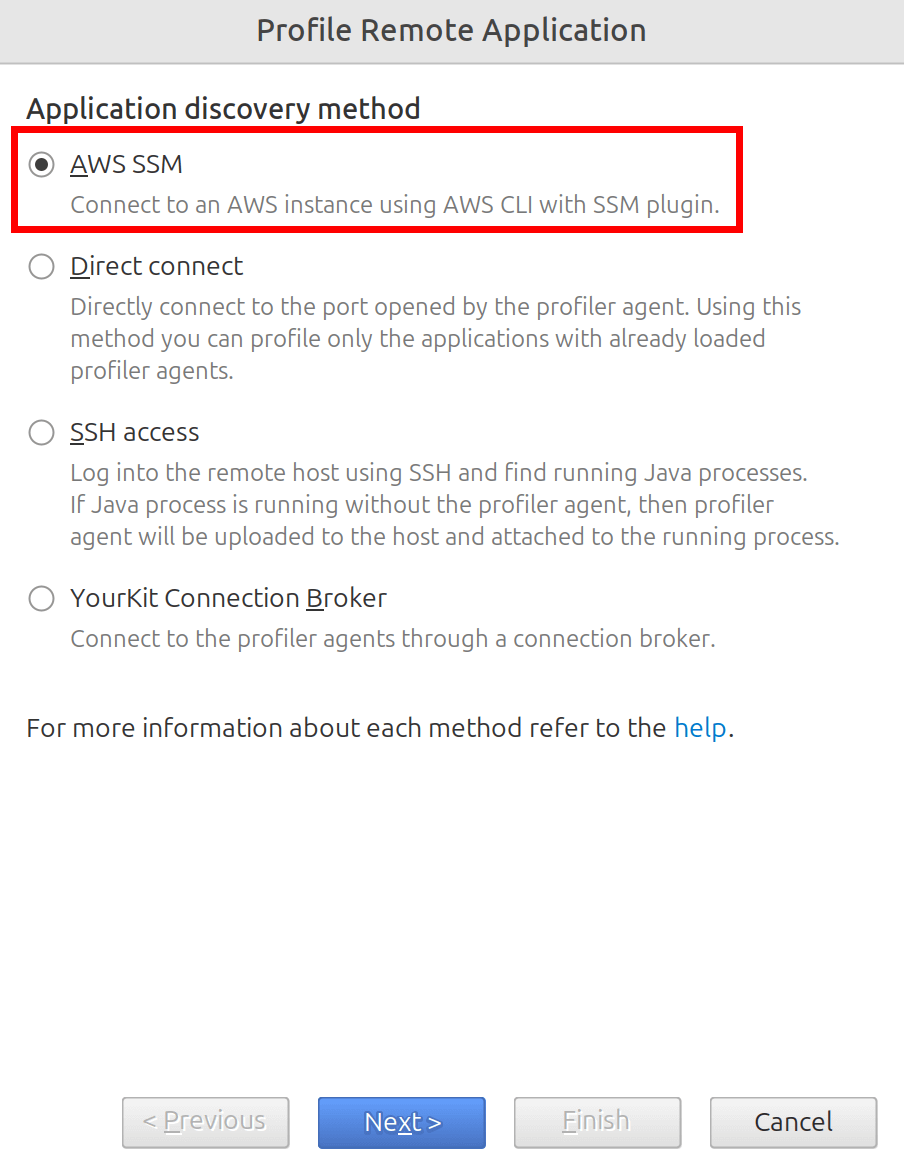
feature The profiler can now use the AWS CLI to connect to a remote AWS instance and profile your remote Java app by specifying the AWS instance ID.
- improvement When profiling a remote application over SSH, the profiler now detects if SSH port forwarding is disabled on the remote server or if the user has no home directory. This helps identify configuration issues early and prevents confusion when the user cannot attach the profiler to their application.
User interface
- improvement Navigation drawers now use space more efficiently and do not take up more horizontal space than necessary.
- improvement Capturing a snapshot no longer stops profiling. To stop profiling, use the Stop profiling action in the toolbar.
- improvement Horizontal toolbars in Telemetry charts and Thread states were replaced with vertical ones to save vertical space.
CPU profiling
- fix Fixed a deadlock that could occur in the OpenJ9 JVM when using virtual threads.
Thread profiling
- feature Since deadlock analysis is part of thread profiling, we have moved the Deadlocks tab inside the Threads tab. Deadlocks is now a tool within Threads. This change simplifies UI and improves user experience.
- feature The profiler agent now stores Java-level deadlock information in snapshots, enabling post-mortem analysis. In previous versions, deadlocks were only available in live profiling sessions.
-
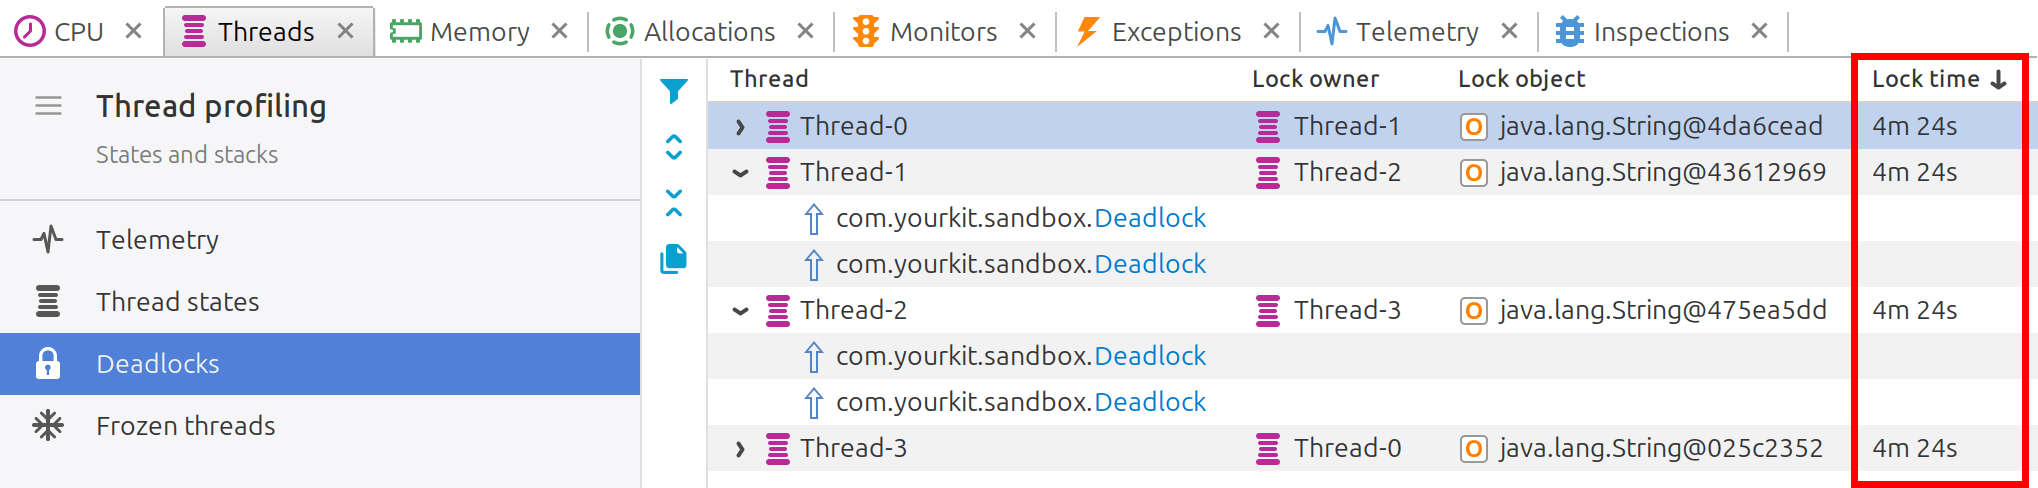
feature The profiler now displays the time spent in a deadlock for deadlocked threads.
-
feature An option
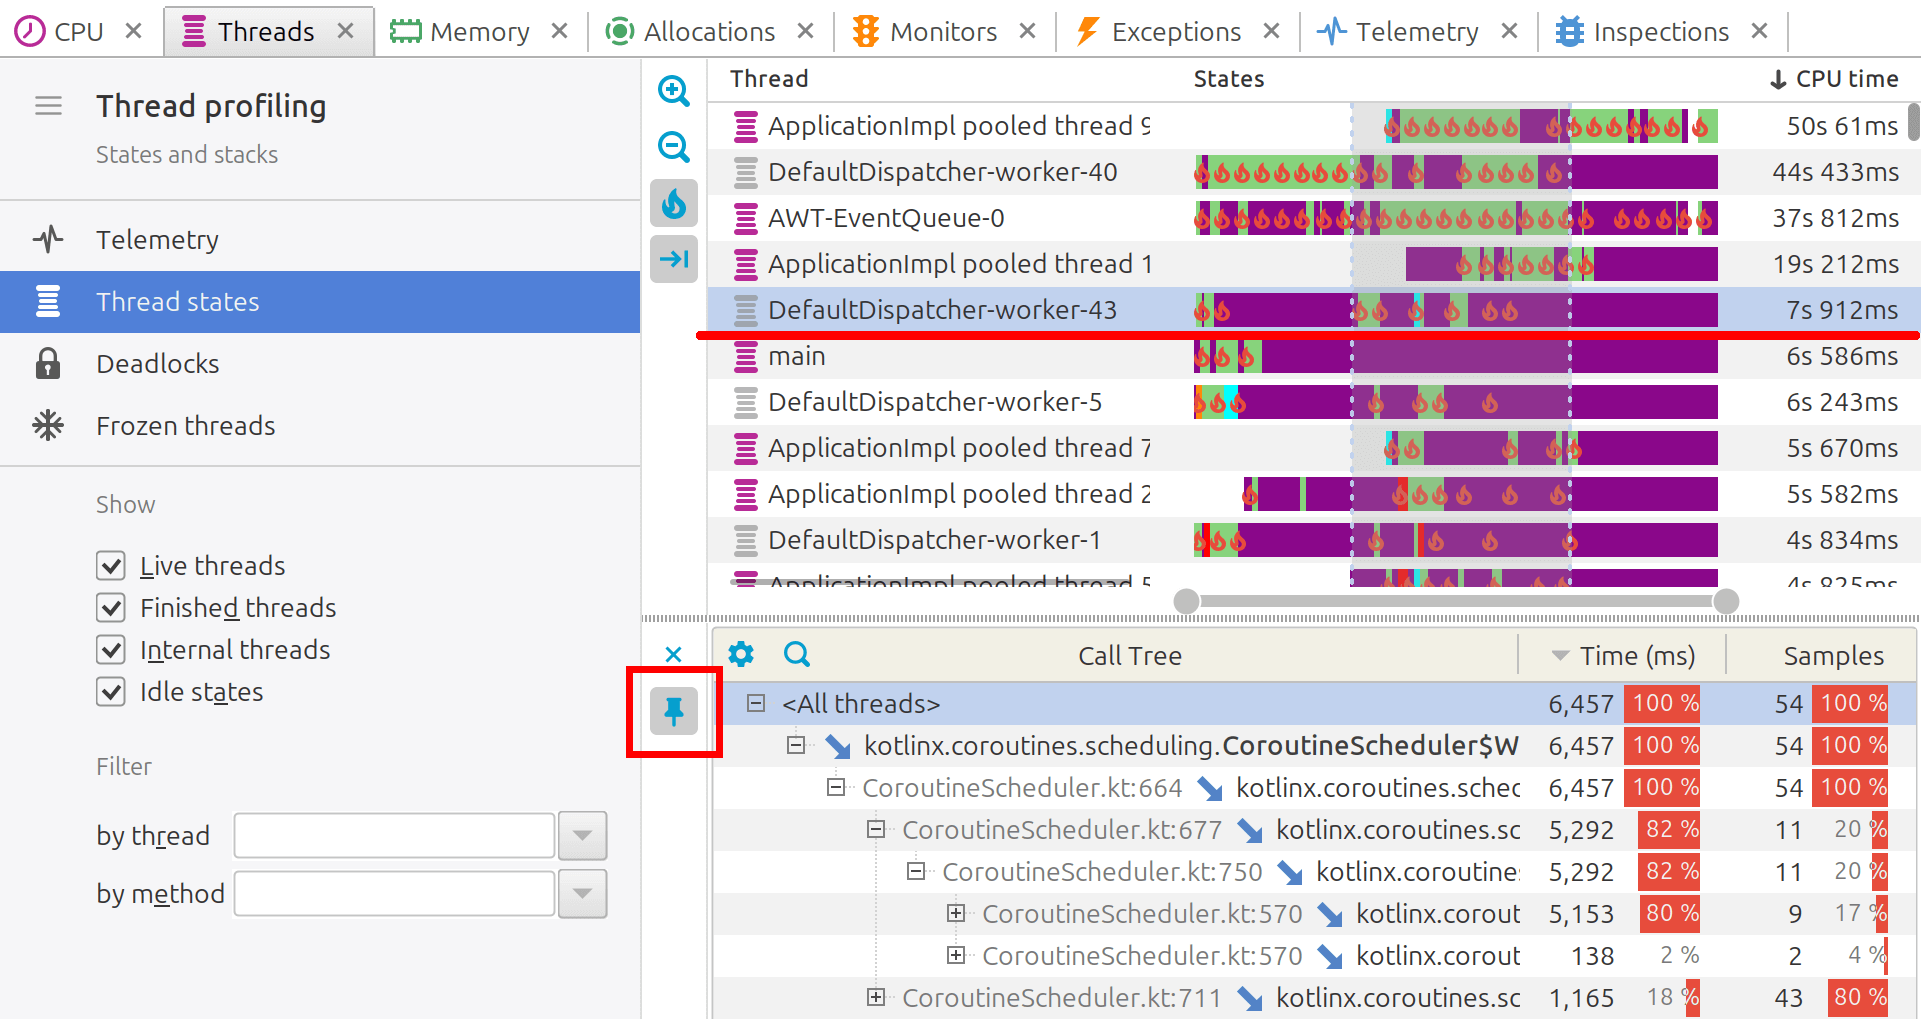
 Focus on selected thread has been added.
It allows you to
estimate CPU usage
of only the selected thread.
Focus on selected thread has been added.
It allows you to
estimate CPU usage
of only the selected thread.
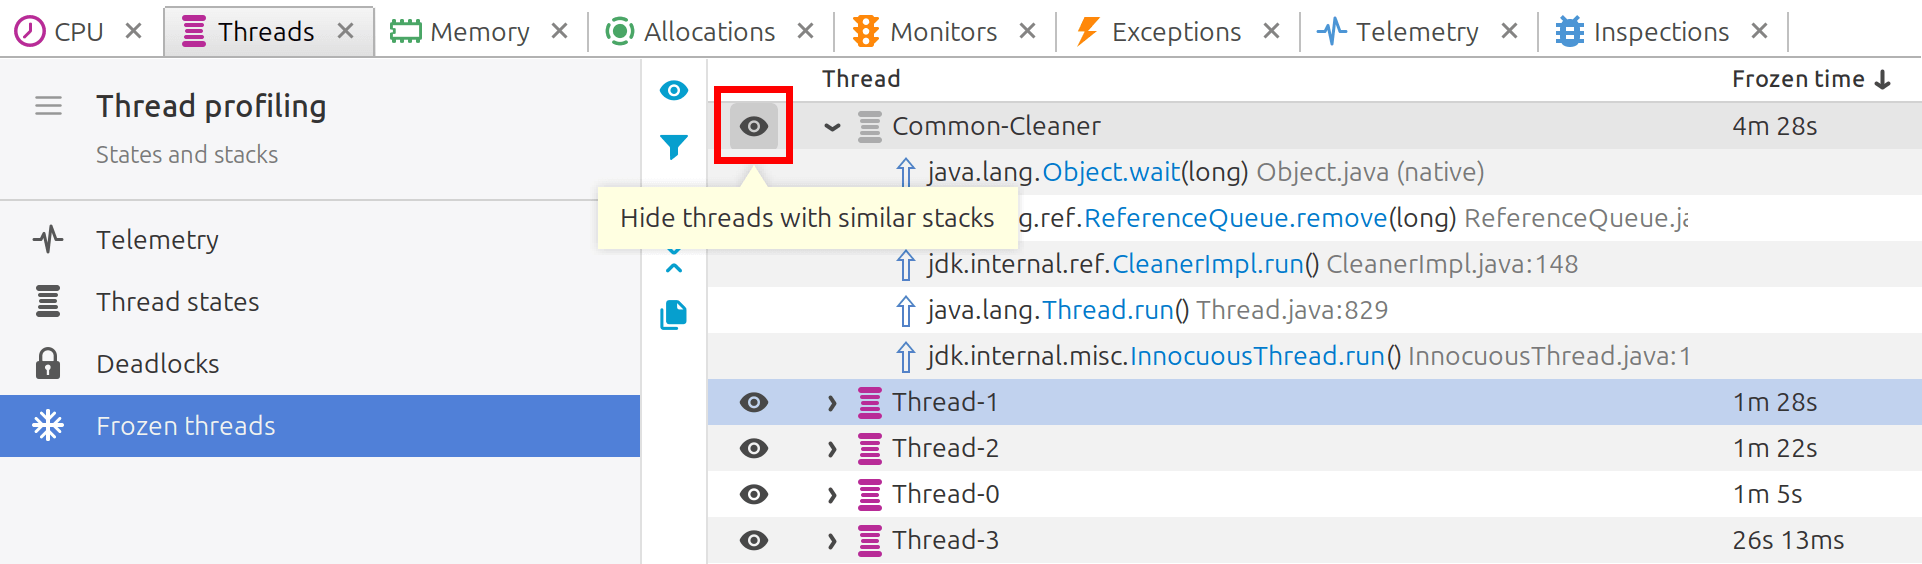
- feature A new Frozen threads view has been added to the Threads tab. The profiler identifies threads that do not change their stacks or consume CPU time and reports them as frozen. These frozen threads may be in a deadlock state or simply long-sleeping or waiting.
-
feature You can now ignore "false positive" frozen threads by hiding threads with similar stacks.
-
feature
New toolbar actions
 Zoom in and
 Zoom out have been added
allowing to choose an arbitrary scale for the thread states timeline.
Zoom out have been added
allowing to choose an arbitrary scale for the thread states timeline.
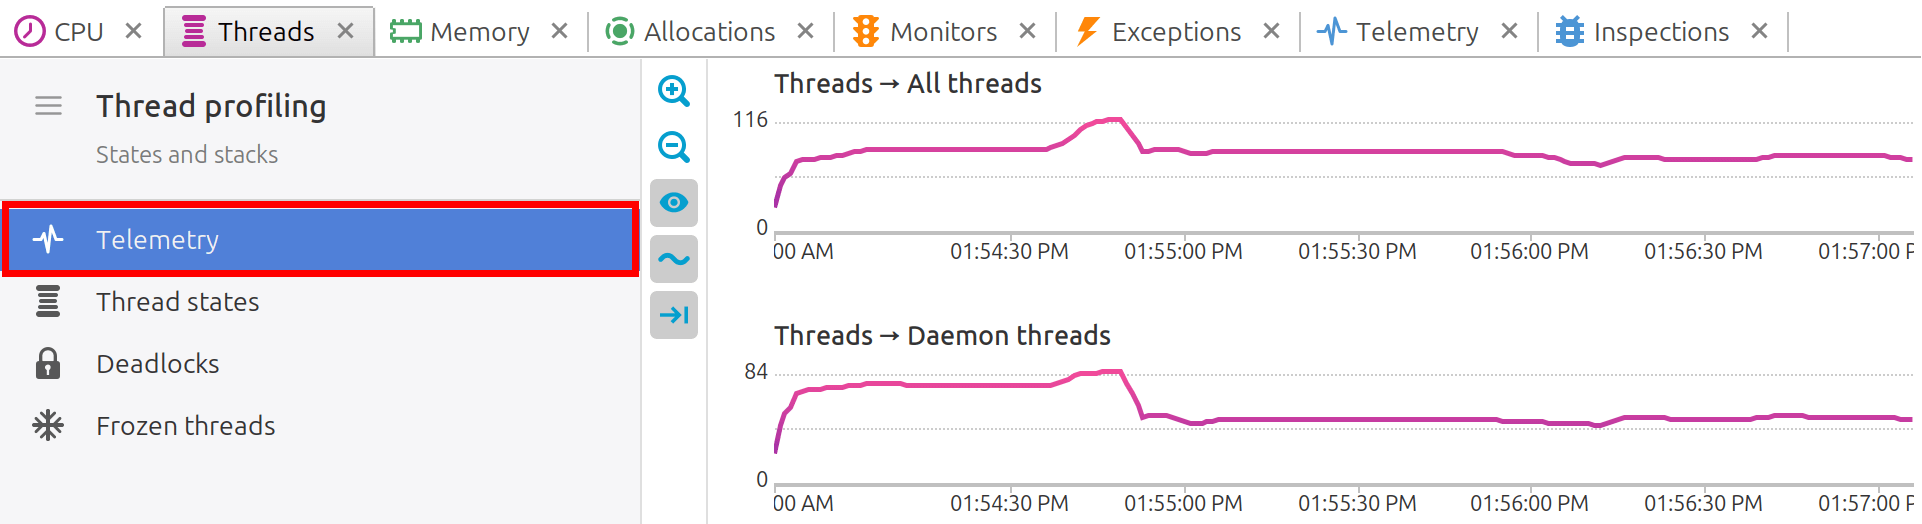
-
feature A new Telemetry section in the Threads tab displays various telemetry charts related to thread activity.
- feature Deadlock profiling is now available in IBM Java. Previously, this feature was only available in HotSpot-based JVMs.
-
feature
The profiler agent now provides a new option,
deadlocks_check_period, to control the frequency of deadlock detection. - improvement The deadlock detector has been optimized - it runs faster, does not block the UI thread, and consumes fewer resources.
Memory profiling
- fix Fixed an issue where the thread state was incorrectly loaded from an HPROF snapshot captured on Java 21.
- fix Displaying Quick info for certain arrays could cause a crash.
Object allocation profiling
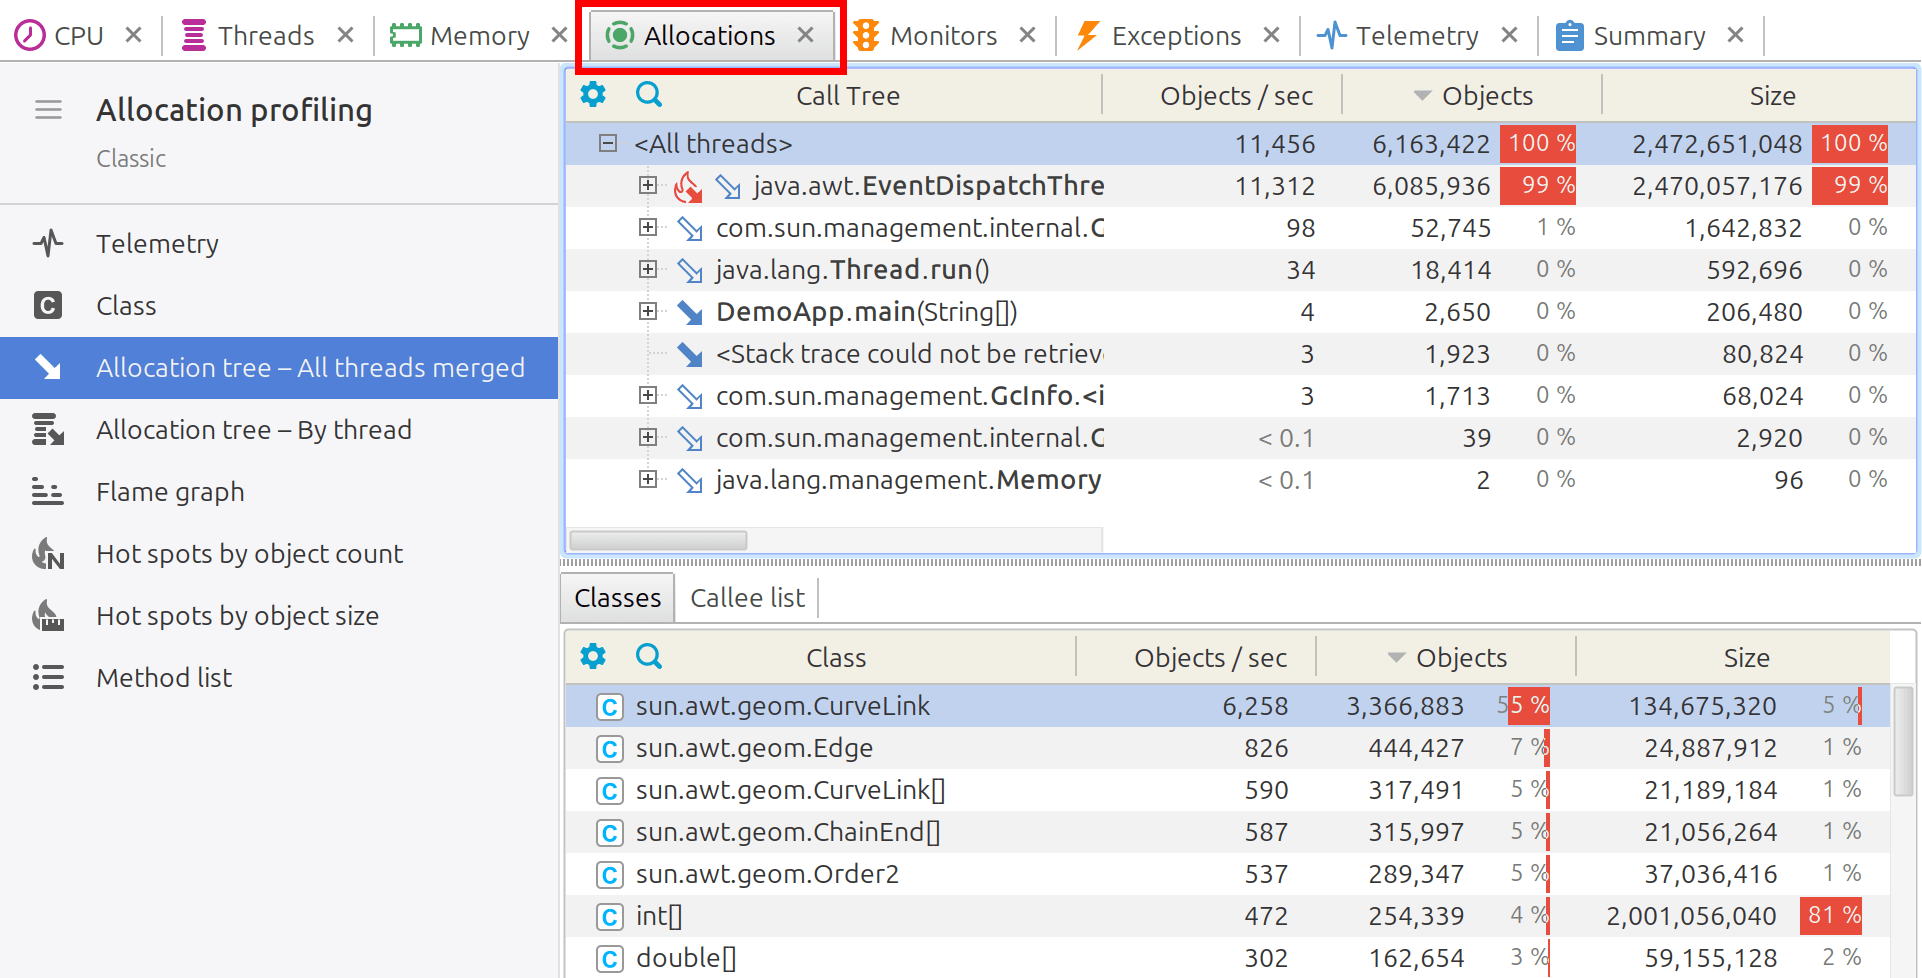
-
feature Allocation profiling has been moved from the Memory tab to a dedicated Allocations tab. YourKit profiler now provides more tools for inspecting object allocations, available in live profiling sessions and when analyzing memory snapshots.
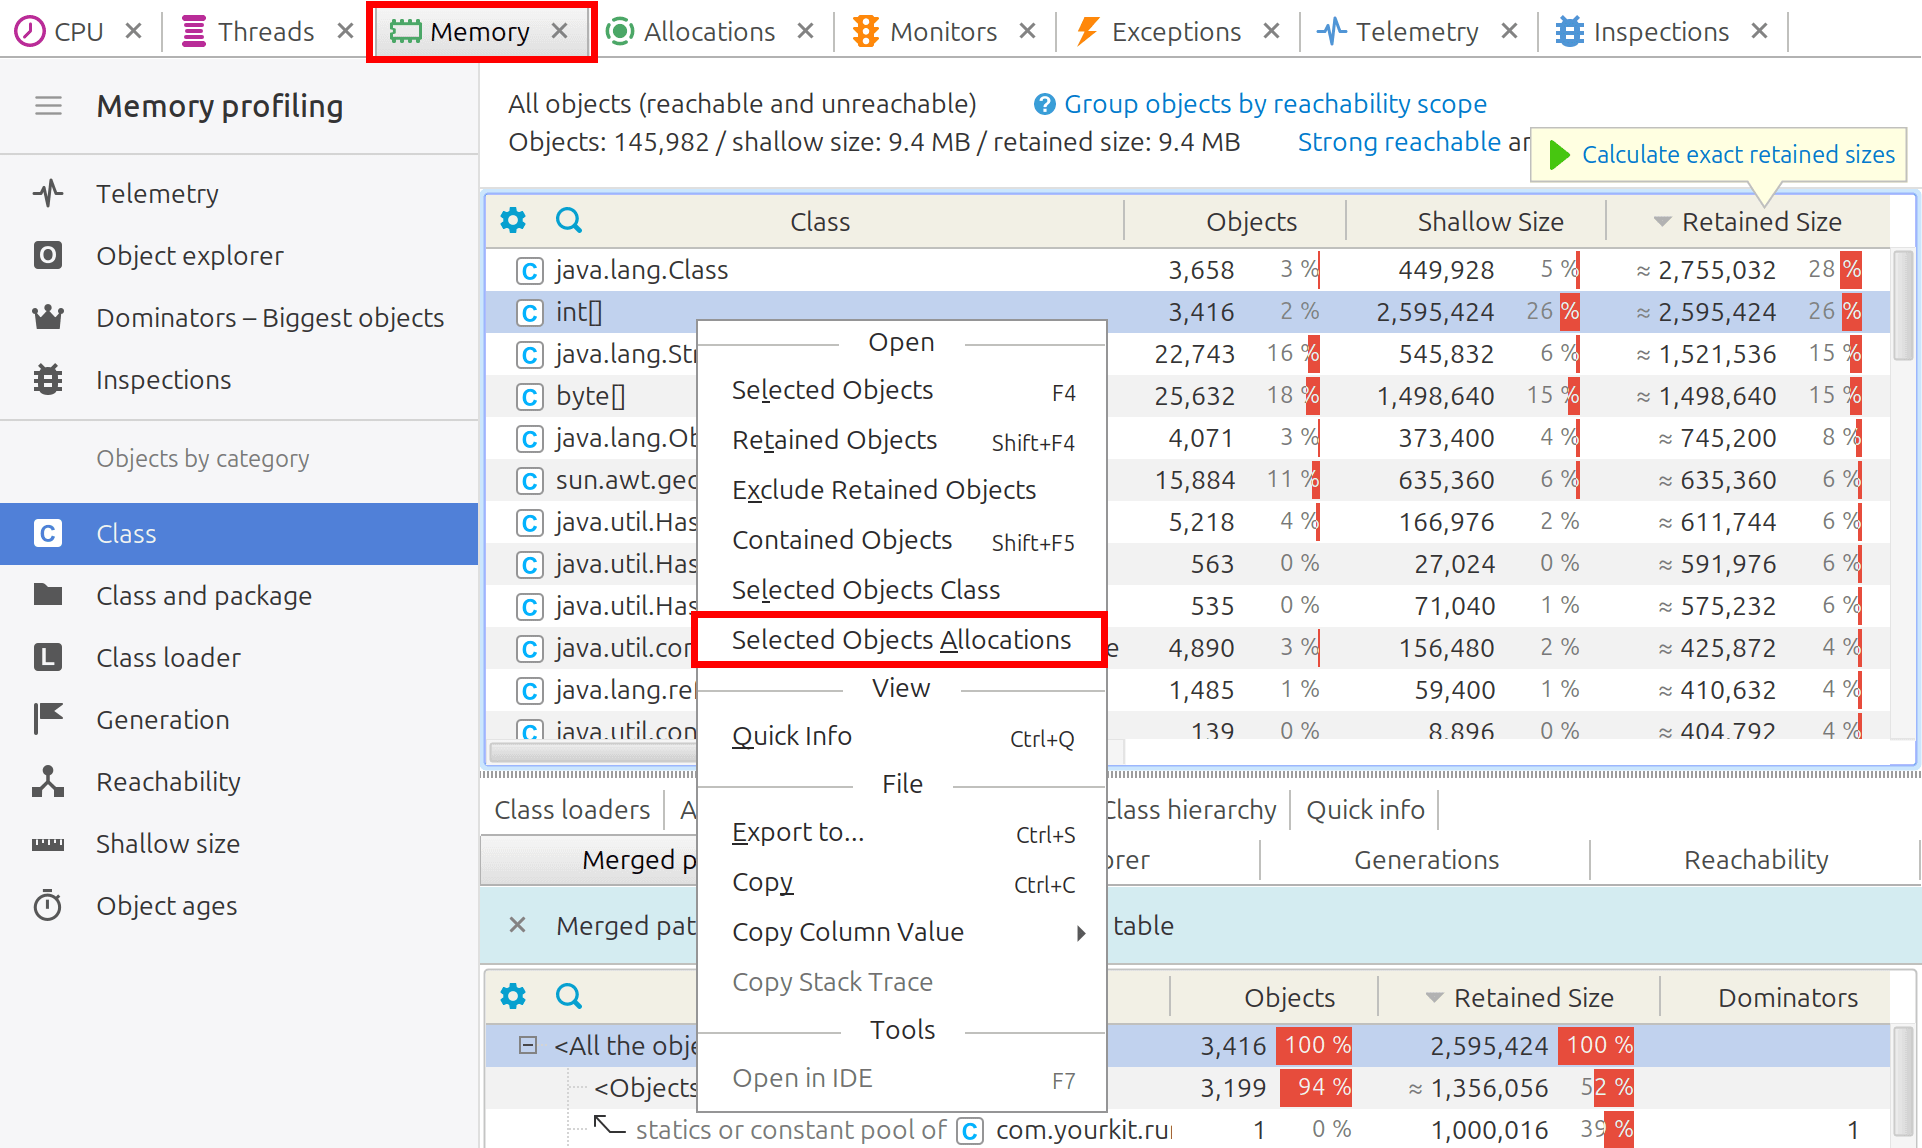
-
feature The new action, Selected Objects Allocation, lets you open objects with recorded allocation details in a new Allocations tab for further analysis. This action is available in the popup menu in all Memory views.
- caveat Instead of memory snapshot, performance snapshot is captured automatically on application exit, if object allocation profiling was running.
- caveat The option to record object allocations with "estimated" stacks has been removed. It often produced confusing and hard-to-interpret results.
- fix Fixed an issue where recorded allocation data was cleared when allocation profiling was stopped.
- fix Fixed an issue in live mode where popup menus could close unexpectedly when the Memory tab was selected.
- fix The Callee list view no longer loses its selection after a refresh in live profiling session.
- fix Fixed issues in object counting mode where the allocated object count was incorrect.
Exception profiling
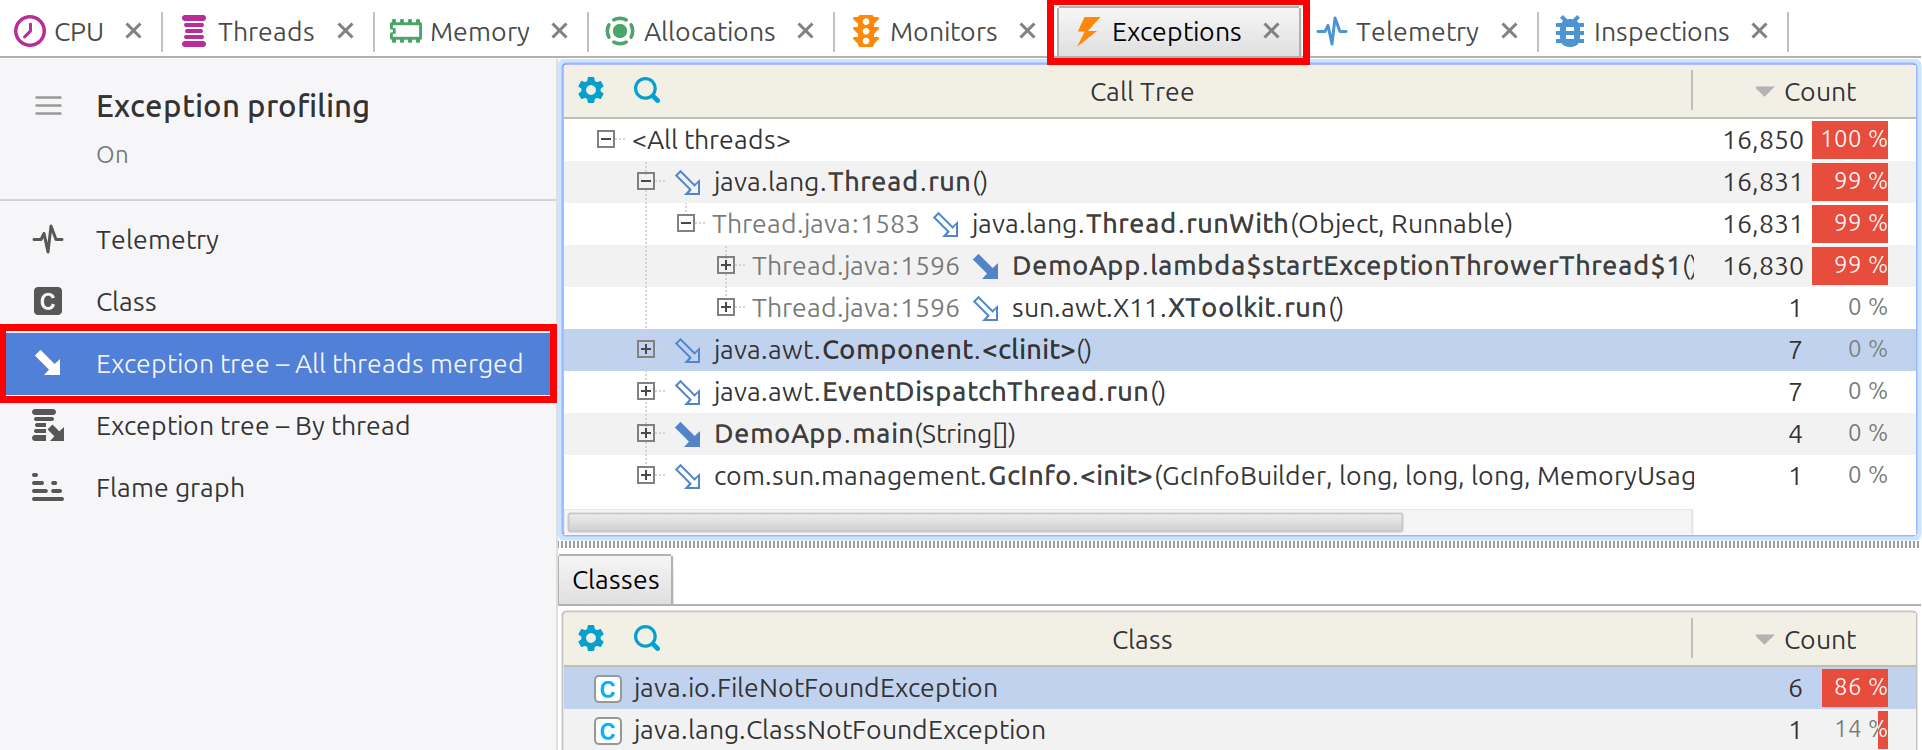
We have completely redesigned the UI for exception profiling. It now resembles the CPU profiling UI and introduces powerful new analysis tools, including an Exception tree that allows grouping exceptions by the threads where they were created, and an Exception flame graph for visualizing exception occurrences.
-
feature The Exception tree, with per-thread grouping, displays stack traces in a hierarchical "tree" format, showing where exceptions were thrown.
-
feature The Exception flame graph visualizes exception occurrences as a flame graph, highlighting where exceptions were thrown.
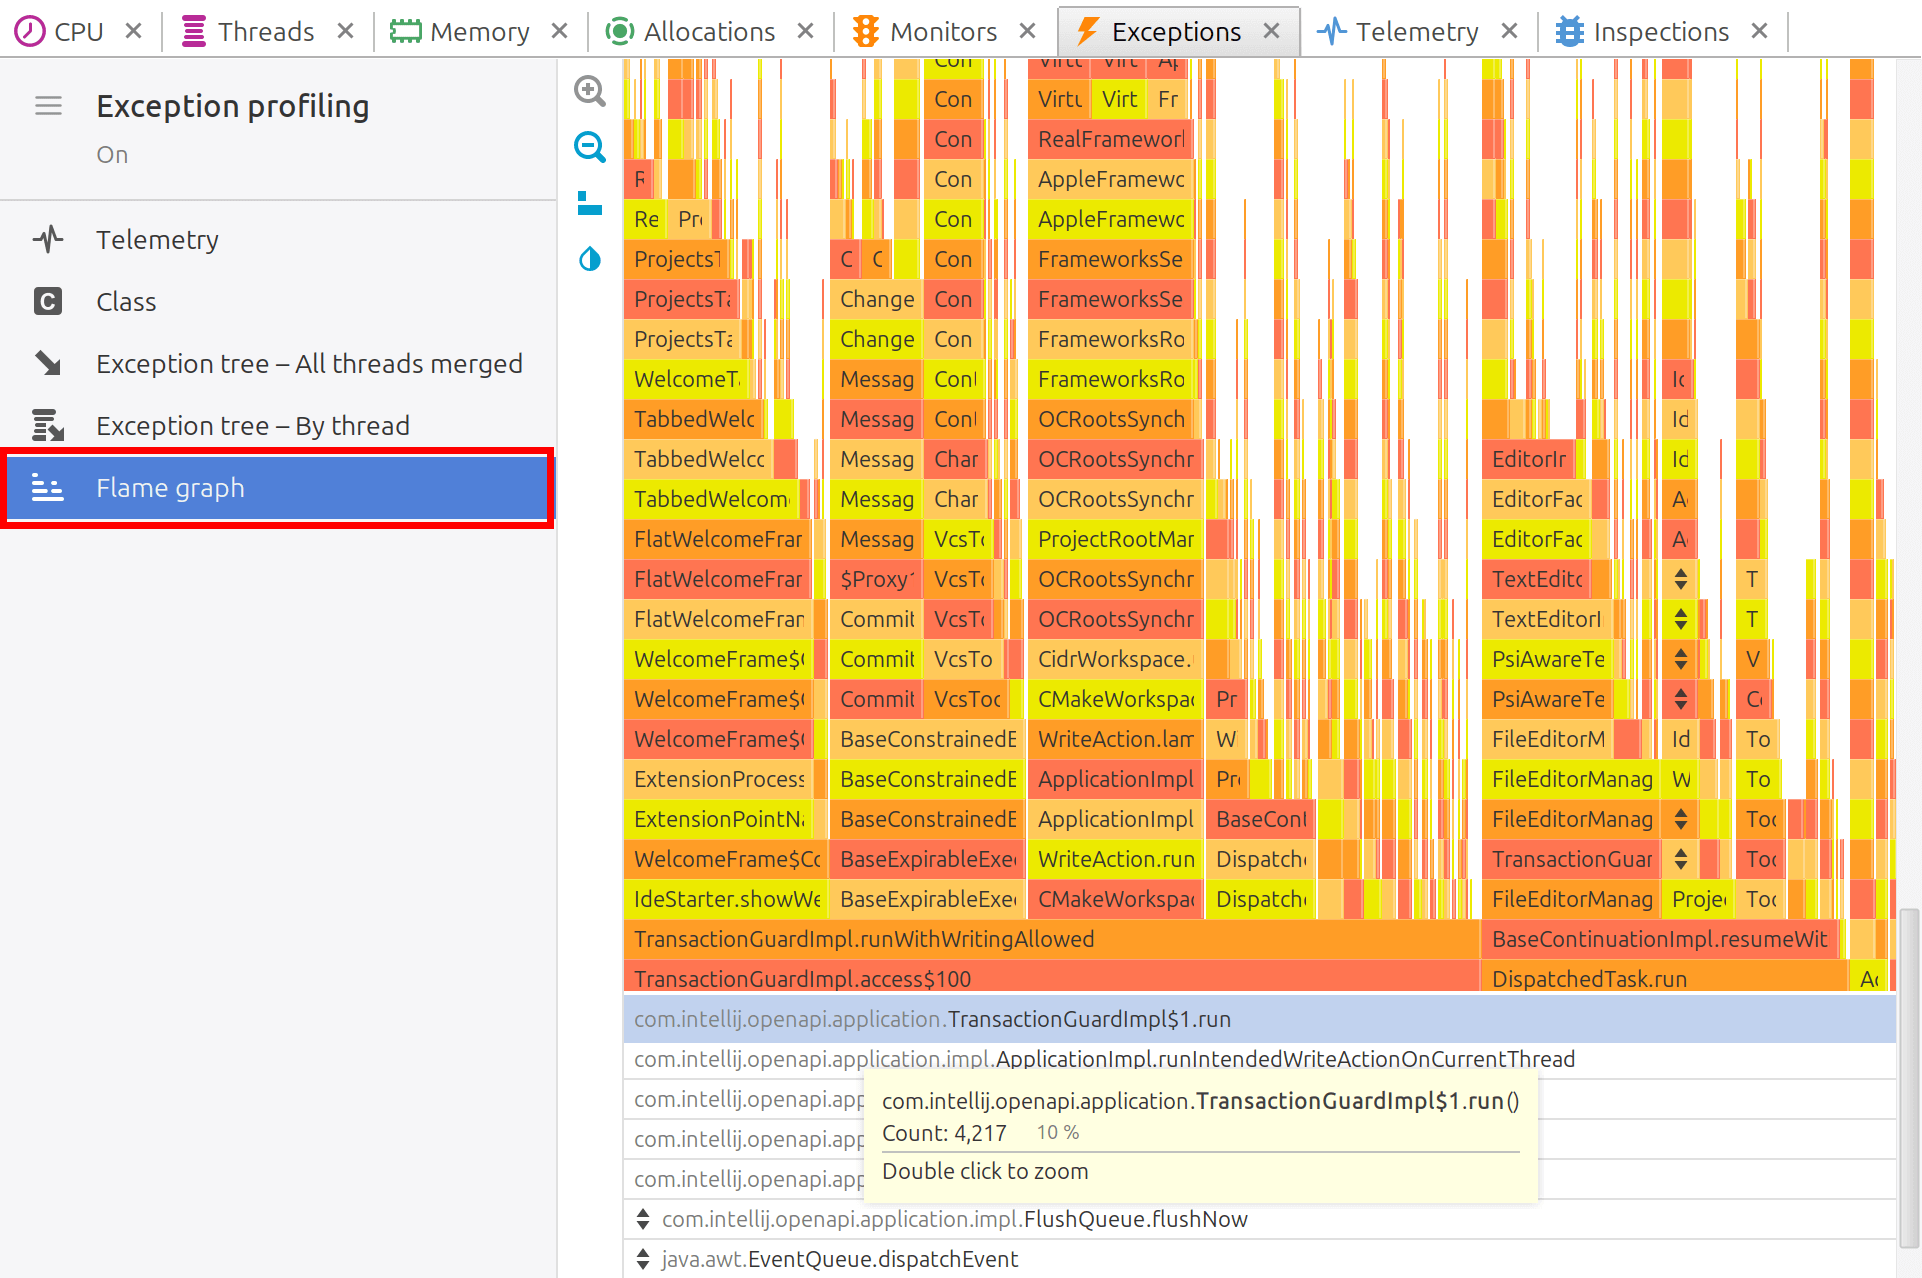
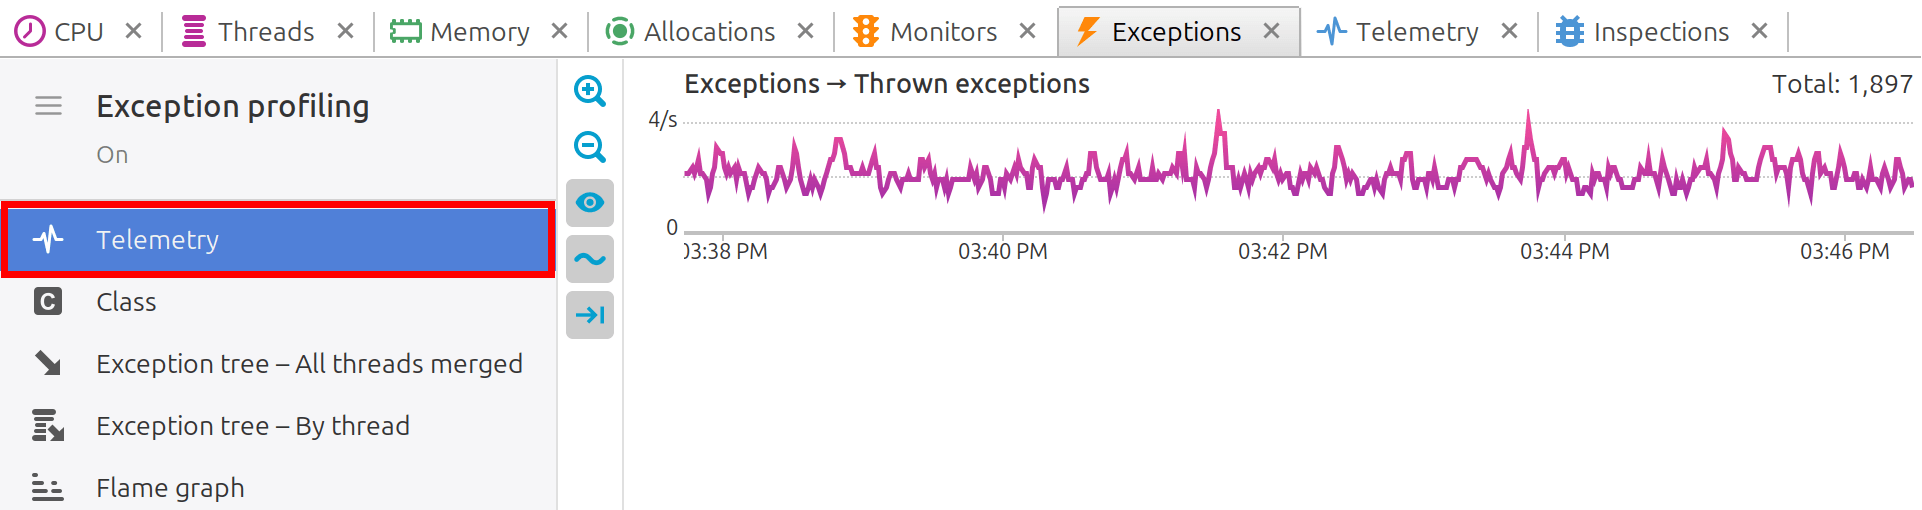
-
feature A new Telemetry section in the Exceptions tab displays telemetry chart of thrown exceptions.
- feature Exception profiling is available in IBM Java.
- improvement Profiling overhead has been reduced when exception profiling is not running.
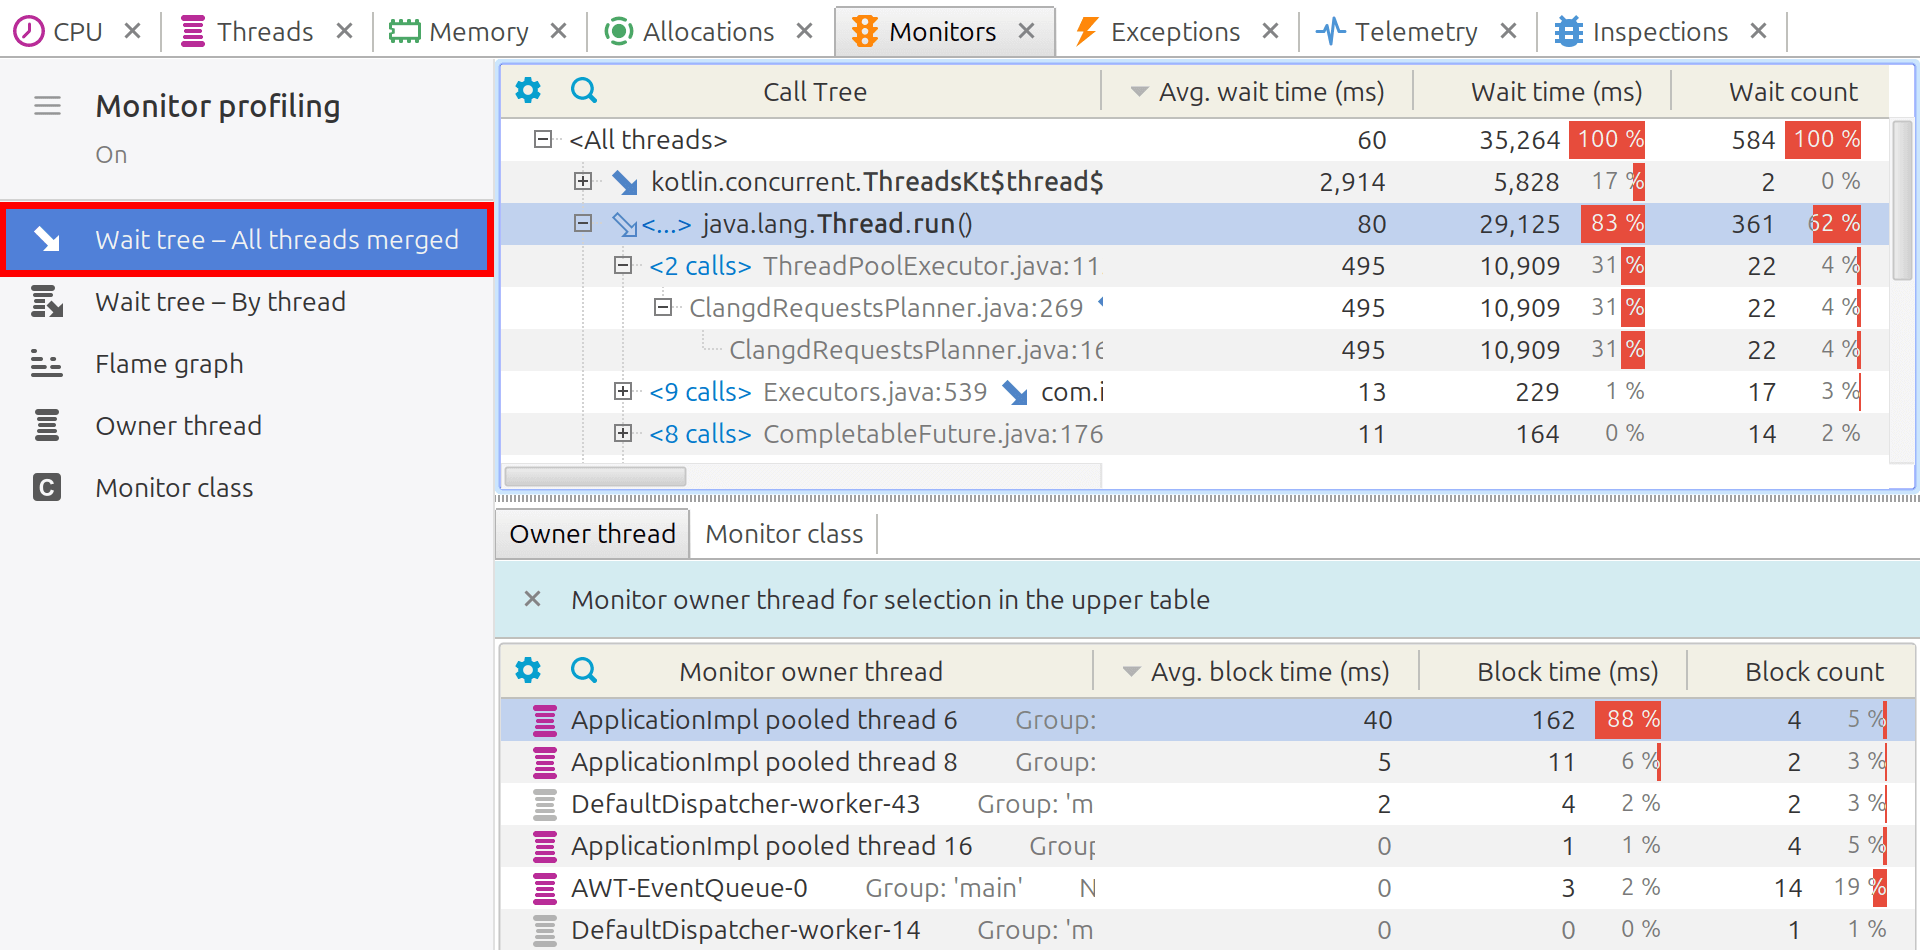
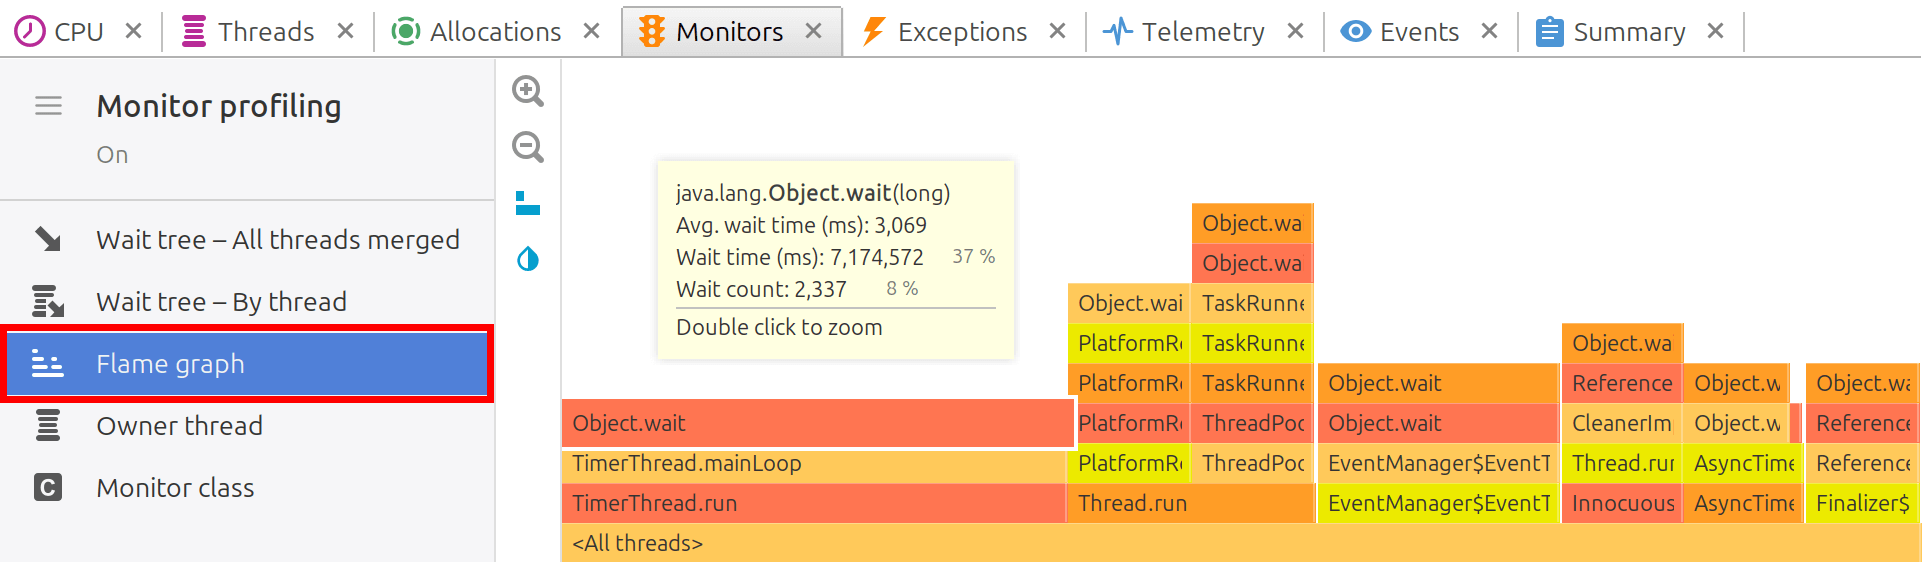
Monitor profiling
The user interface of Monitors tab has been significantly redesigned, improved, and unified with other parts of the profiler. New tools have been introduced for analyzing waiting and blocking events: Wait tree, with thread-based grouping, Monitors flame graph, and tools for analyzing monitors owned by threads and those where waiting and blocking occurred.
-
feature The Monitors wait tree, with per-thread grouping, displays stack traces in a hierarchical "tree" format, showing where threads were waiting or blocked.
-
feature We have introduced the Monitor flame graph, a new visualization tool that highlights where threads were waiting or blocked. It enables faster analysis of contention issues.
-
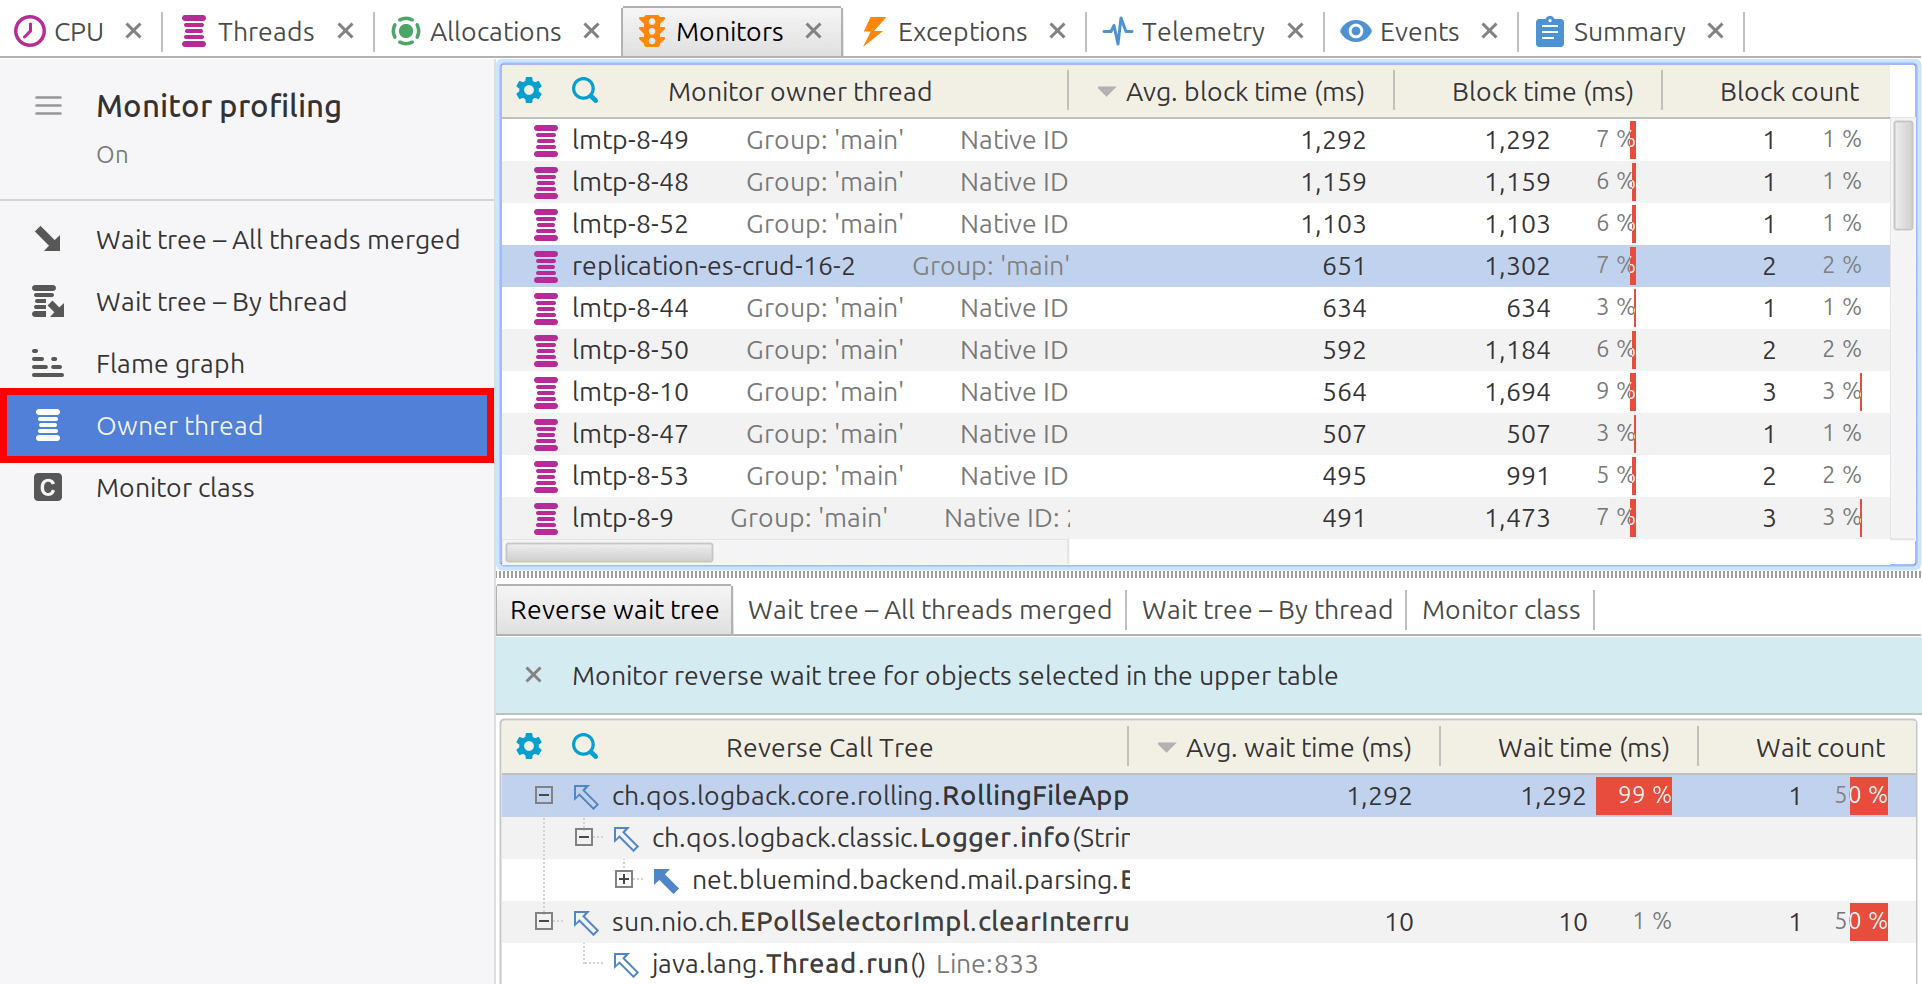
feature New Owner thread view displays the number of times and the total duration a thread has been blocked while attempting to acquire a Java monitor.
-
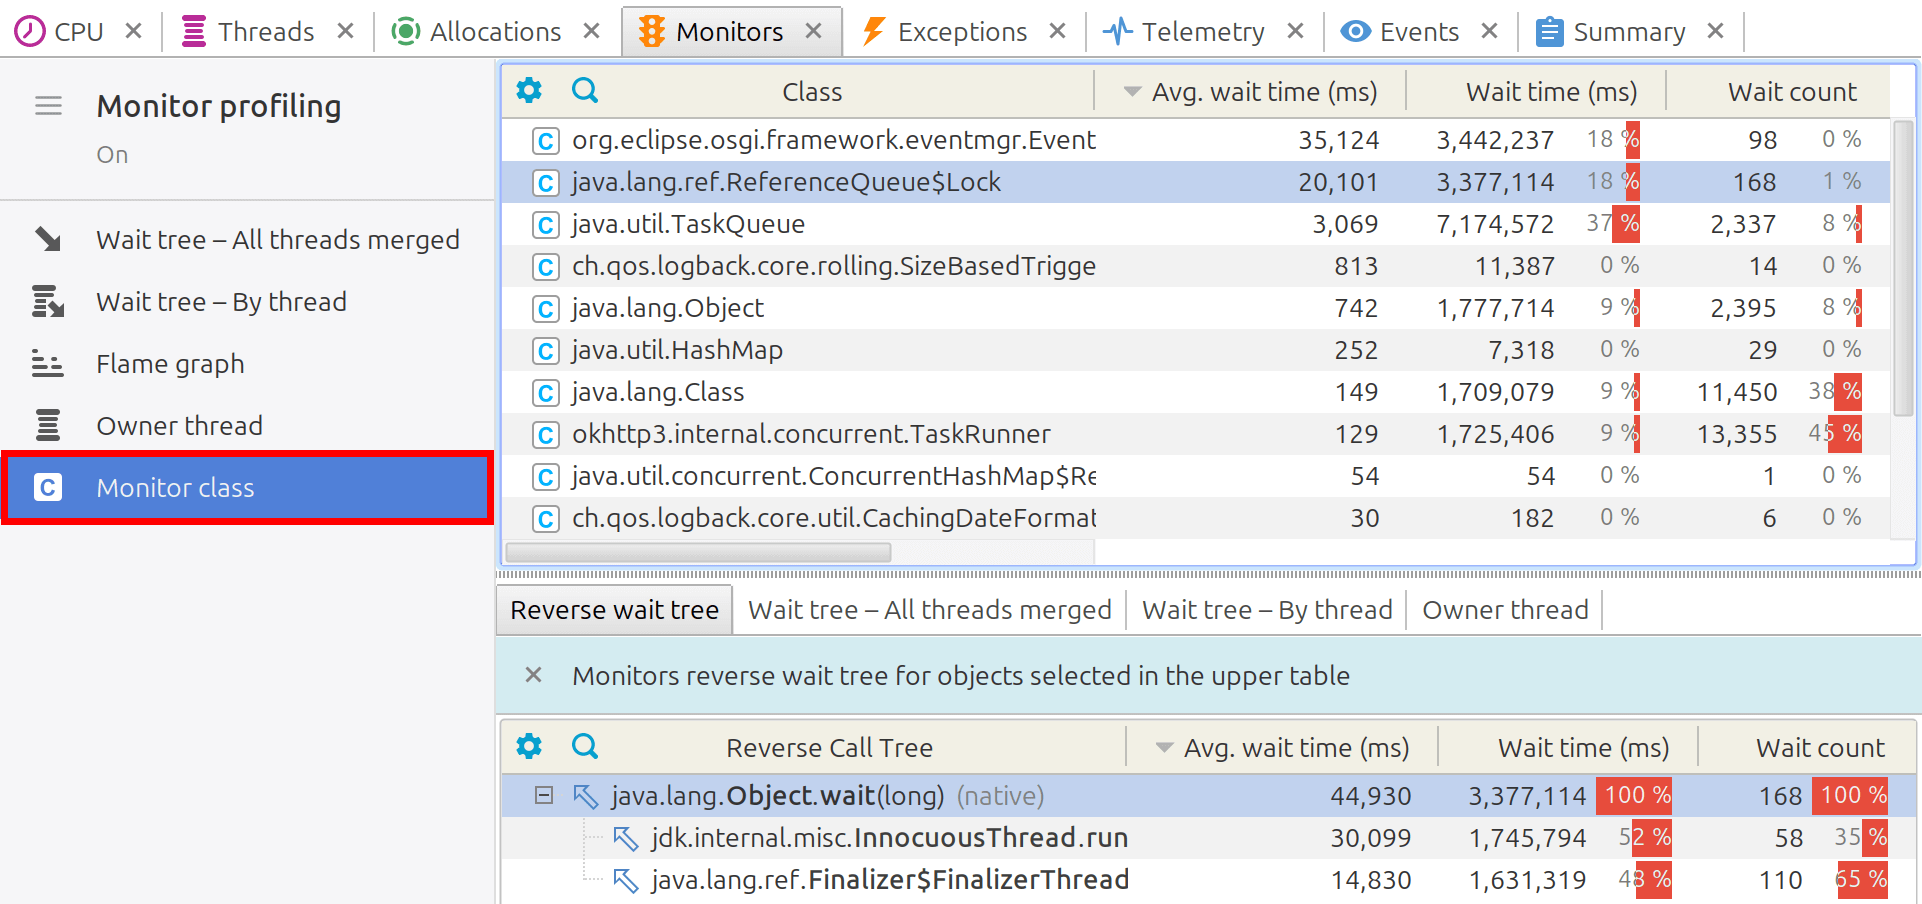
feature New Monitor class view shows how many times and for how long threads waited to acquire a specific monitor object.
- improvement Average wait time is now shown for threads.
Telemetry
-
feature
New toolbar actions
Zoom in and
Zoom out have been added
allowing to choose an arbitrary scale for the telemetry charts.
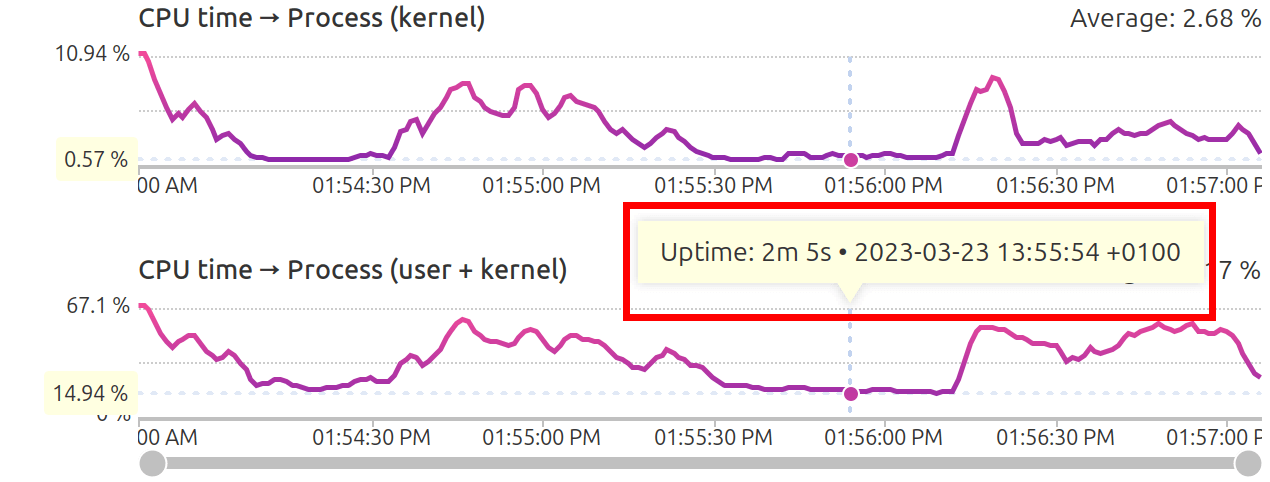
-
feature A tooltip displaying uptime and clock time is shown above the telemetry chart.
IDE integration
- feature Eclipse 2025-03 is supported.
- feature IntelliJ IDEA 2025.1 is supported.
- feature NetBeans 25 is supported.
EE server support
- feature Apache Tomcat 11 is supported.
- feature Apache TomEE 10.0 is supported.
- feature Open Liberty 25 is supported.
- feature WebSphere Liberty 25 is supported.
- feature WildFly 35 is supported.
Triggers
- caveat The trigger actions deprecated in previous releases have been removed.