- System requirements
- Profiler architecture
- Profiler installation
- Uninstall profiler
- Running the profiler
- Profiler activation
- Welcome screen
- Start profiling
- Profiling overhead
- Snapshots
- Solving performance problems
- CPU profiling
- Thread profiling
- Virtual threads support
- Object allocation profiling
- Memory profiling
- Monitor profiling
- Exception profiling
- Telemetry
- Probes: monitor events of various kinds
- Inspections: automatic recognition of typical problems
- Automatically trigger actions on event
- Automatic deobfuscation
- Summary
- Filters
- Profiler command line
- Export of profiling results to external formats
- Profiler Java API
- Profiler HTTP API
- Settings
- Troubleshooting and FAQ
Profiling in Amazon EC2 instance
1. Getting IP and key
In this example we will use SSH connection to the Amazon EC2 instance to profile a Java application. First you need to know a public IP address. Select your instance in EC2 Management Console and find the address at "IPv4 Public IP" in "Description" tab.
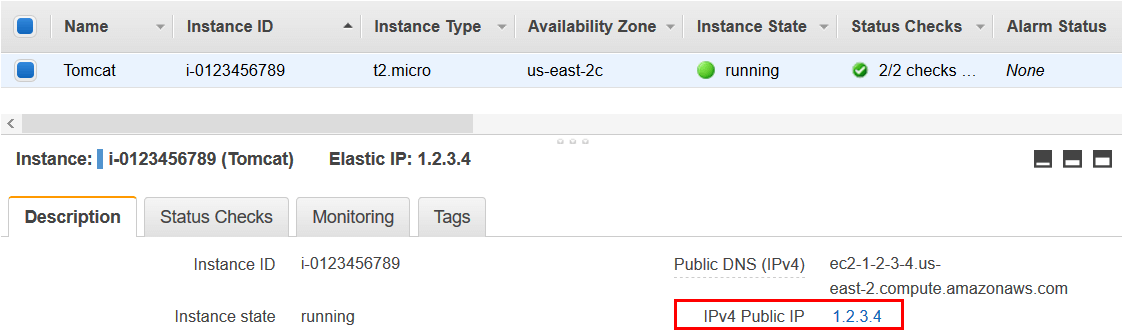
To get authentication key see "Key pair name" in "Description" tab and locate the corresponding key on your computer. We will use key pair aws-key-pair and aws-key-pair.pem file, which was generated by the Management Console.

Amazon Linux image, like in this example, has default user with the name ec2-user. If you have different image, please see its documentation or consult system administrator to obtain your authentication settings.
2. Profile Remote Application dialog
Use Profile remote Java server or application... action on Welcome screen or in Profile menu.

In the opened dialog choose SSH access application discovery method.
Enter public IP address noted above. Provide SSH port, SSH user and the private key in the corresponding fields.

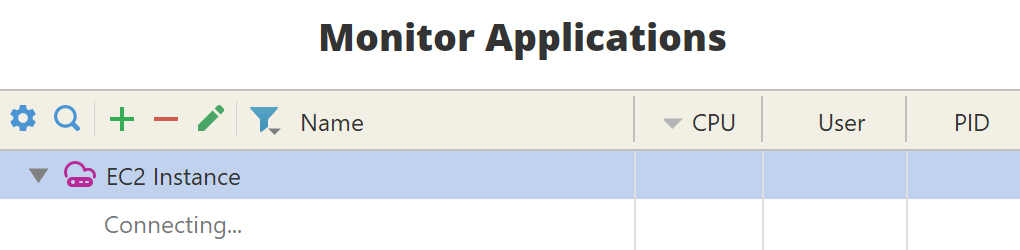
Created connection will appear in the Monitor Applications list on Welcome screen.
3. Connect from Welcome Screen
In the first communication profiler will upload all necessary files, and you will see "Connecting..." message. This might take up to a few minutes depending on your network speed.
4. Attach to the application
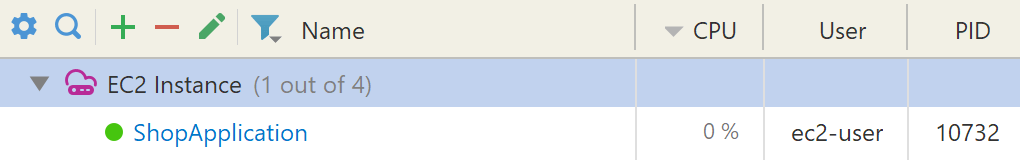
Applications without the profiler agent are marked with orange circle. You can attach and profile the application, by clicking on its name. Please note that you will not see applications running under a different user, unless your start it with the profiler agent.

Applications running with the profiler agent are marked with green circle. Click on the application name to connect and profile it.
If you do not see your application it the list, please check troubleshooting and FAQ.
5. Start application with the profiler agent
If attach doesn't work for you, consider starting the Java application with the profiler agent following one of the other methods.