- System requirements
- Profiler architecture
- Profiler installation
- Uninstall profiler
- Running the profiler
- Profiler activation
- Welcome screen
- Start profiling
- Profiling overhead
- Snapshots
- Solving performance problems
- CPU profiling
- Thread profiling
- Virtual threads support
- Object allocation profiling
- Memory profiling
- Monitor profiling
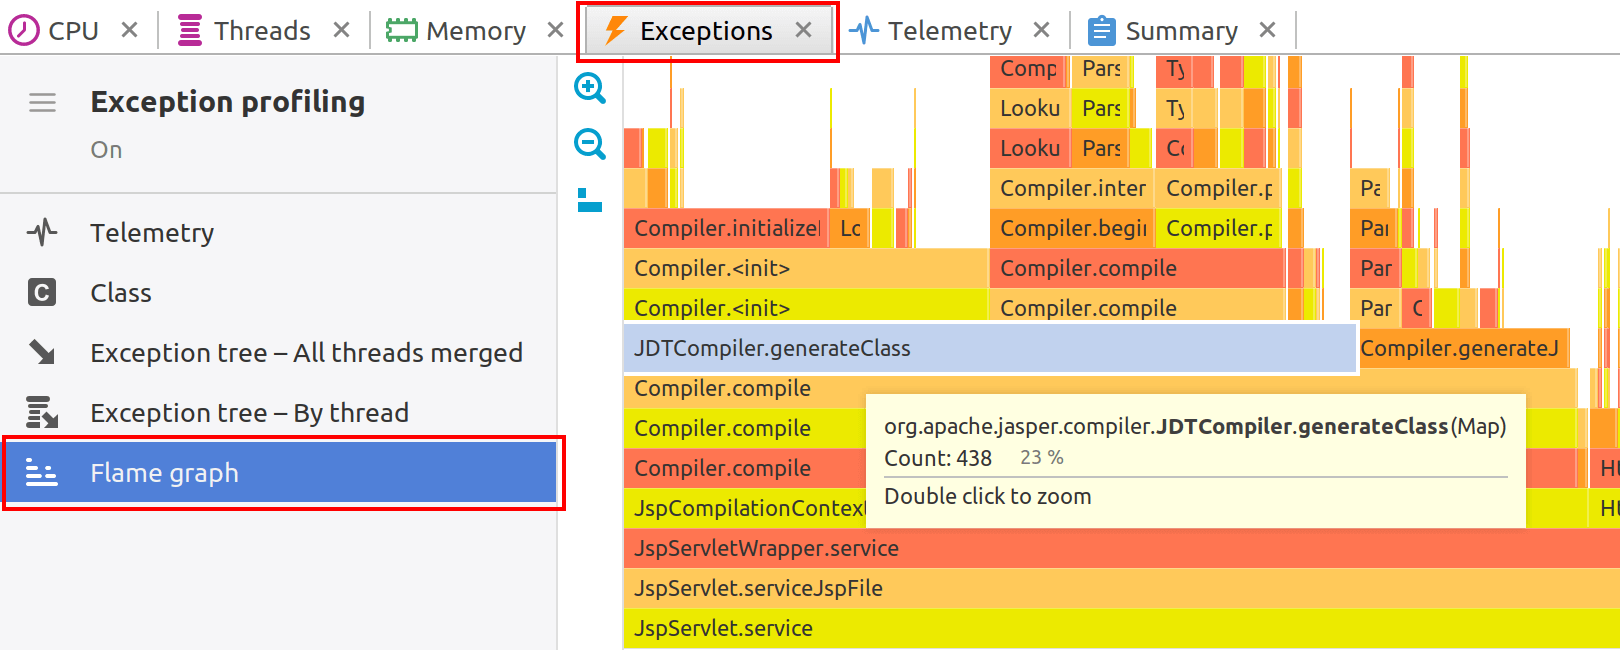
- Exception profiling
- Telemetry
- Probes: monitor events of various kinds
- Inspections: automatic recognition of typical problems
- Automatically trigger actions on event
- Automatic deobfuscation
- Summary
- Filters
- Profiler command line
- Export of profiling results to external formats
- Profiler Java API
- Profiler HTTP API
- Settings
- Troubleshooting and FAQ
Exception flame graph
Exception flame graph visualizes the exception tree, making execution paths where more exceptions were thrown wider and more visible on the graph.
Layout
Along the horizontal axis, the flame graph draws stacks sorted by the number of thrown exceptions. You always see the most contributing methods on the left side of the graph, which simplifies analysis.
The width of the graph element is proportional to the number of exceptions in the corresponding stack frame. The wider the element, the more exceptions were thrown inside.
Call stacks are laid out vertically and grow from bottom to top.
Colors
The colors of the graph have no specific meaning. They simply serve to visually separate neighboring elements and are chosen from a flame palette. A red-colored element does not indicate that the method is more important.
Legend
When you move the mouse pointer over the graph elements, a balloon with a legend will be displayed. It shows the fully qualified method name with parameter types, as well as the wait time and wait count.
Zoom
Sometimes you may need to closely inspect a short method. Since short methods are typically narrow, the graph might not be able to display their called methods. In such cases, you can zoom in on the method. The entire graph will be scaled, and the zoomed element will span the entire screen width, revealing hidden details. Zooming in can be activated by double-clicking or using the popup menu. ESC resets zoom and returns graph to its original scale.
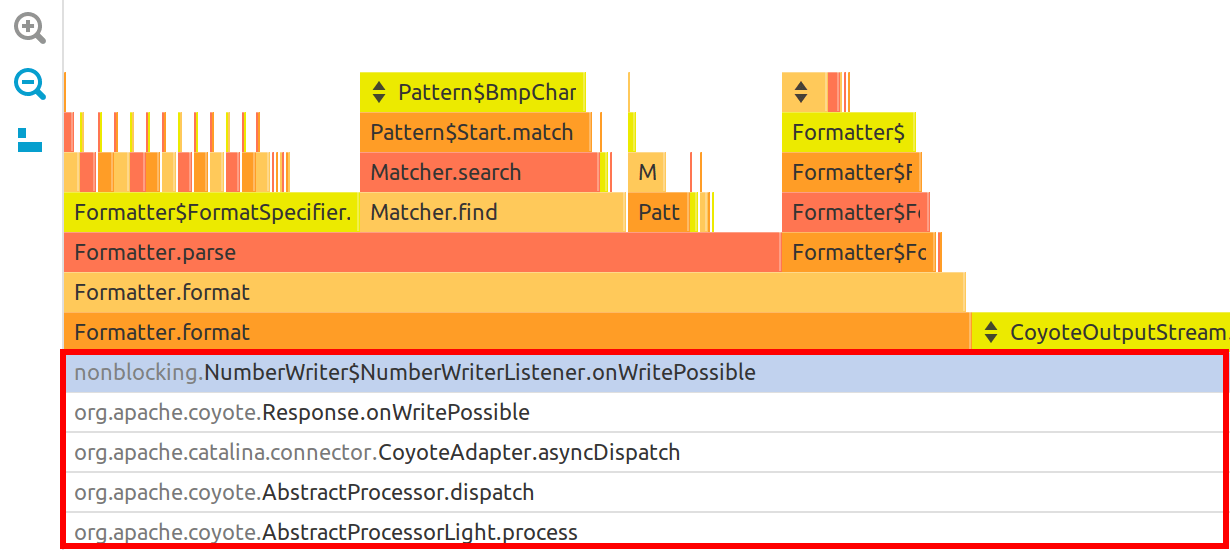
Filters
Flame graph respects filter settings and collapse
filtered methods the same way as a call tree. Inside filtered elements
you will see small button that allows to unfilter the element. You can always undo the unfiltering
by using the Ctrl+Z shortcut or via the popup menu.
that allows to unfilter the element. You can always undo the unfiltering
by using the Ctrl+Z shortcut or via the popup menu.
Actions
The following actions are available in the popup menu:
- File | Export to... (Ctrl+S) - exports flame graph to PNG image.
- Tools | Open in IDE (F8) - opens method declaration in IDE editor. See IDE integration.