Objects without allocation information

Questions about YourKit Java Profiler
Post Reply
fxbird
Posts: 2
Joined: Mon May 26, 2014 4:35 pm

Objects without allocation information

Post by fxbird »

Hello all:
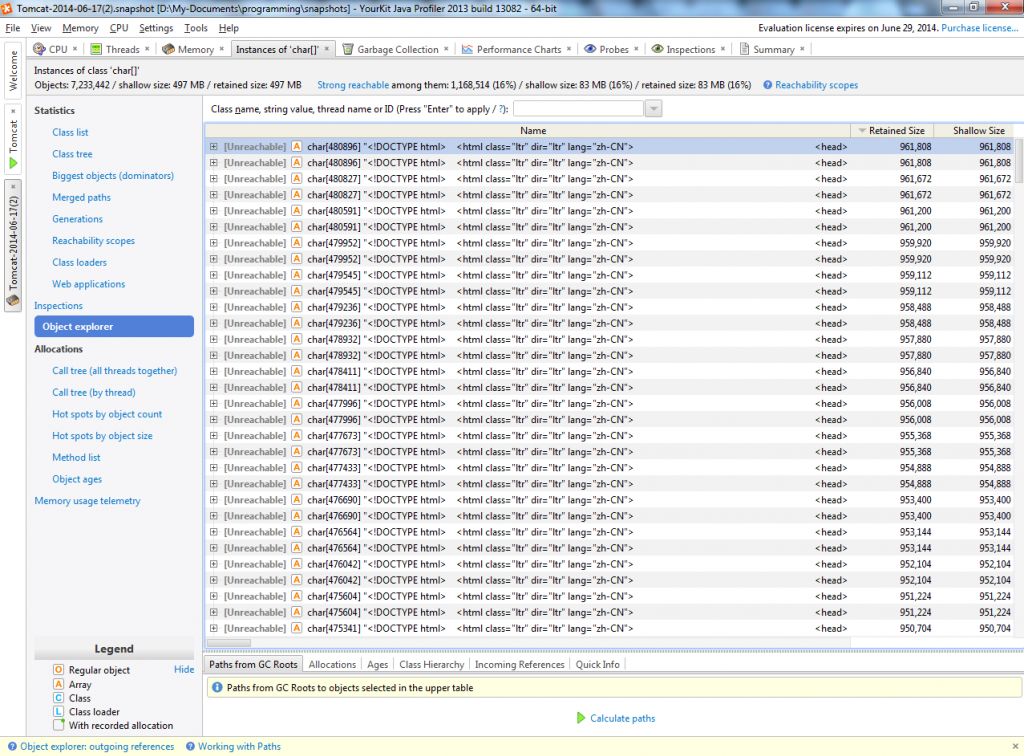
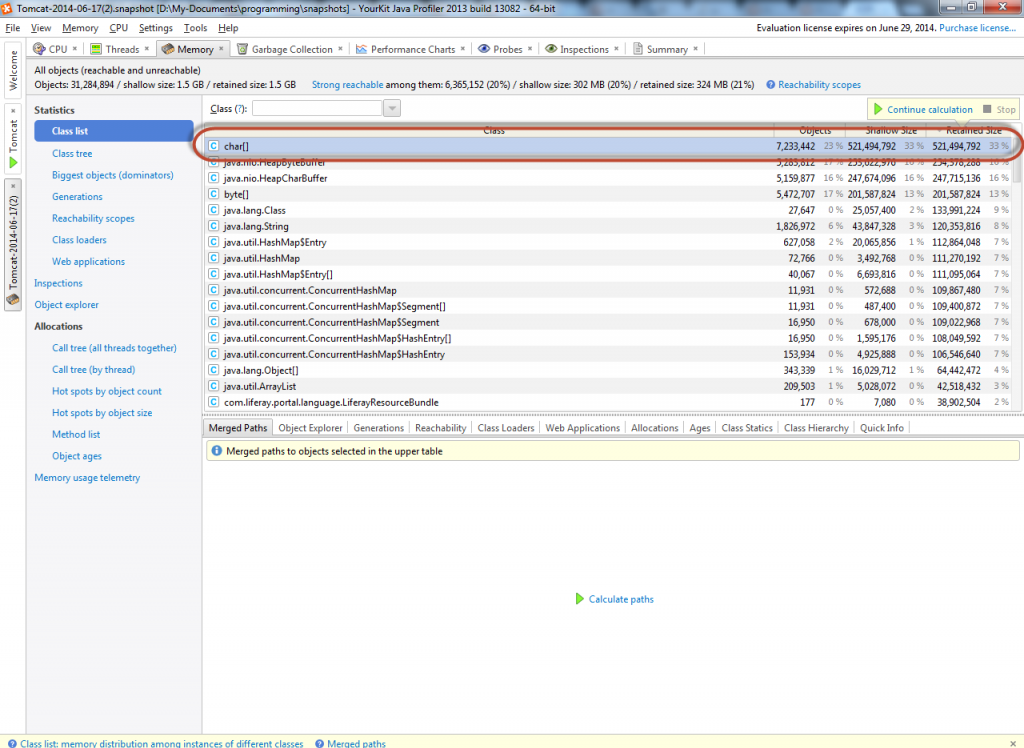
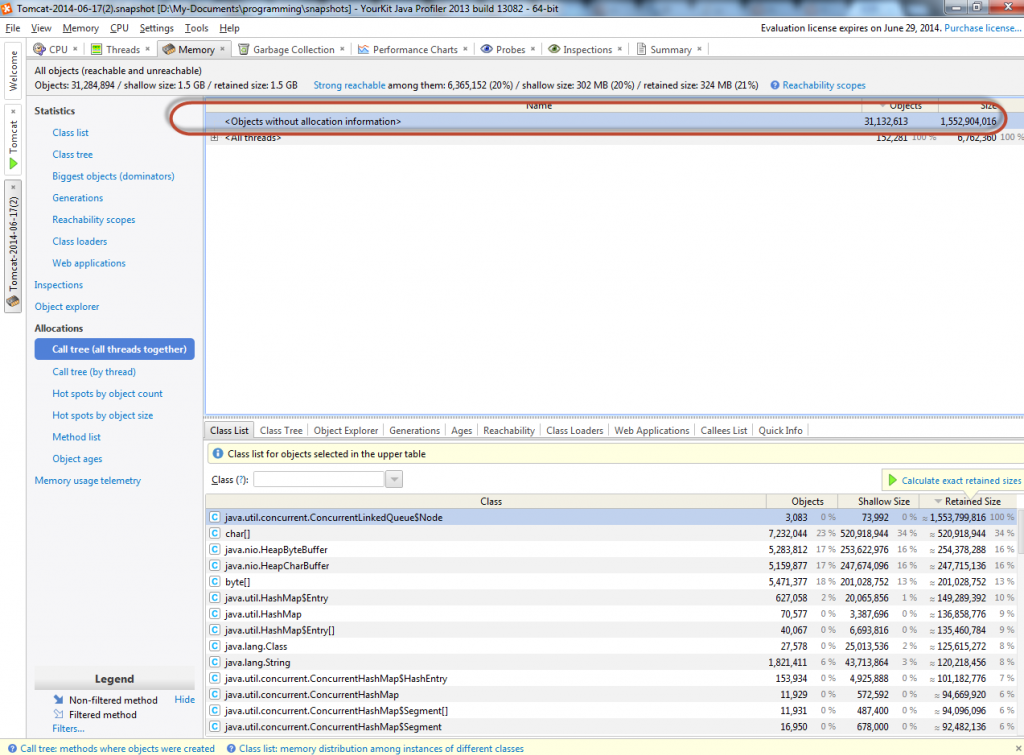
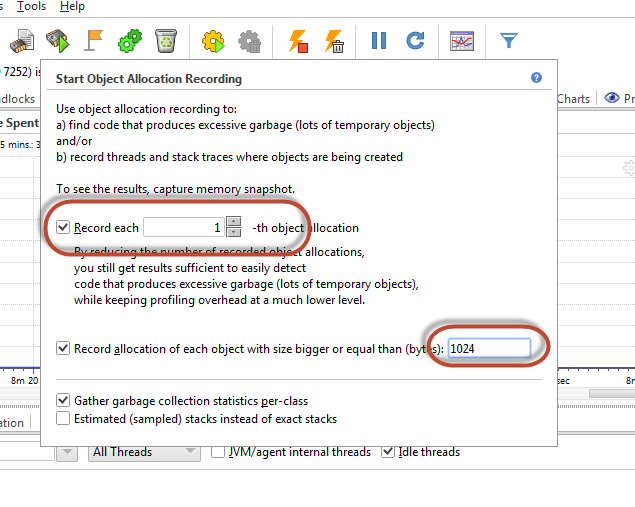
I'm using liferay 6.1.1 CE and noticed memory use increase very fast, so I used yourkit to try to analyze the root cause of it, "Object allocation recording " was enabled. Then I found there was always a big char[] but it's unreachable even I enabled "Object allocation recording ", I'm sure that the logner I use the profiled application, the bigger the char[]. I tried everything I know, but failed to get the place where it was generated. Please take a look at the snapshots. In the allocation view the big object were not captured because it said 'Objects without allocation information'.

Image
Image
Image
Image

Don't know if my method is not right.
Anton Katilin
Posts: 6172
Joined: Wed Aug 11, 2004 8:37 am

Re: Objects without allocation information

Post by Anton Katilin »

Hello fxbird

Unfortunately, there are strange problems displaying the screenshots: sometime they show, sometime a broken image placeholder is shown.
Could you please use another picture sharing service, or send the files attached to [email protected]

Anyway, from what we could see:
1. You record each object, and it's good.
2. The memory snapshot contains many unreachable objects with unknown allocations, and it is strange.

Could you please try whether the problem is reproducible with version 2014 EAP:
http://www.yourkit.com/eap

You'll need to re-run the profiled application to obtain a new snapshot.


Could you please ZIP the problematic snapshot file (.snapshot), use DropBox or alike service and provide the download URL.
If you can't share the snapshot in the public forum, please send the download link to [email protected]

Best regards,
Anton
fxbird
Posts: 2
Joined: Mon May 26, 2014 4:35 pm

Re: Objects without allocation information

Post by fxbird »

Anton Katilin wrote:Hello fxbird

Unfortunately, there are strange problems displaying the screenshots: sometime they show, sometime a broken image placeholder is shown.
Could you please use another picture sharing service, or send the files attached to [email protected]

Anyway, from what we could see:
1. You record each object, and it's good.
2. The memory snapshot contains many unreachable objects with unknown allocations, and it is strange.

Could you please try whether the problem is reproducible with version 2014 EAP:
http://www.yourkit.com/eap

You'll need to re-run the profiled application to obtain a new snapshot.


Could you please ZIP the problematic snapshot file (.snapshot), use DropBox or alike service and provide the download URL.
If you can't share the snapshot in the public forum, please send the download link to [email protected]

Best regards,
Anton
Hello Anton Katilin:
Thanks for your quick response. I used latest eap version to inspect the memory allocation yesterday but I had no luck. So I changed the picture sharing service and upload the memory snapshot, pls look at below, hopefully you can see them all this time.
Image
Image
Image
Image

From above you can see there was much big objects with unknown allocation information, its size is over 1GB.

You can also download the memory snapshot file at http://pan.baidu.com/s/1ntlx2eH hosted in China, clicking two hyperlinks as below instructions.
Image
Image

Thanks
Anton Katilin
Posts: 6172
Joined: Wed Aug 11, 2004 8:37 am

Re: Objects without allocation information

Post by Anton Katilin »

Hello fxbird

Thank you for uploading the snapshot.

Please see the "Events" tab (or "Probes" if you work with YJP 2013), select table Messages.

The messages from the "Profiler" category tell that you started and stopped allocation recording several times, and it's OK.
However, the parameter Record each is sometimes 10, which explains why 9 of 10 objects were not recorded.

Please ensure you specify Record each = 1 each time you start allocation recording .
This setting is not persisted is you restart the profiler UI and/or re-connect to the profiled application instance.

Best regards,
Anton
Post Reply