Changes in version 2024.3
- .NET support
- macOS support
- Networking
- Security
- User interface
- CPU profiling
- Thread profiling
- Telemetry
- Events
- IDE integration
- Exception profiling
- Profiler API
- Triggers
- Miscellaneous
- Deprecations
.NET support
- caveat Minimum supported .NET Framework version is 4.6.1.
macOS support
- improvement The Monitor Applications list now displays the CPU usage for .NET processes on macOS.
Networking
-
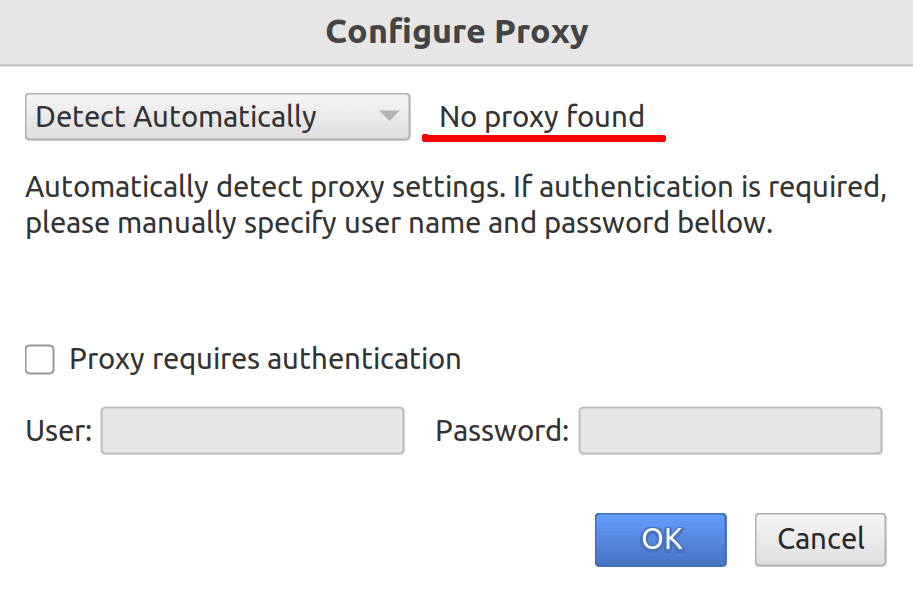
feature The profiler displays detected proxy settings when using the automatic proxy detection mode (the default mode). This can be very useful in cases where the profiler incorrectly identifies the proxy server, preventing connections with remote agents.
Security
-
improvement
Profiler agent does not log command line options unless the
verboseoption is specified.
User interface
- feature We've enhanced the user experience for two-finger scrolling. The profiler eliminates minor finger tremors during scrolling, ensuring a smooth, jitter-free scroll. Currently, this functionality is utilized in the Threads view, but it will be adapted across other parts of the UI in upcoming versions.
-
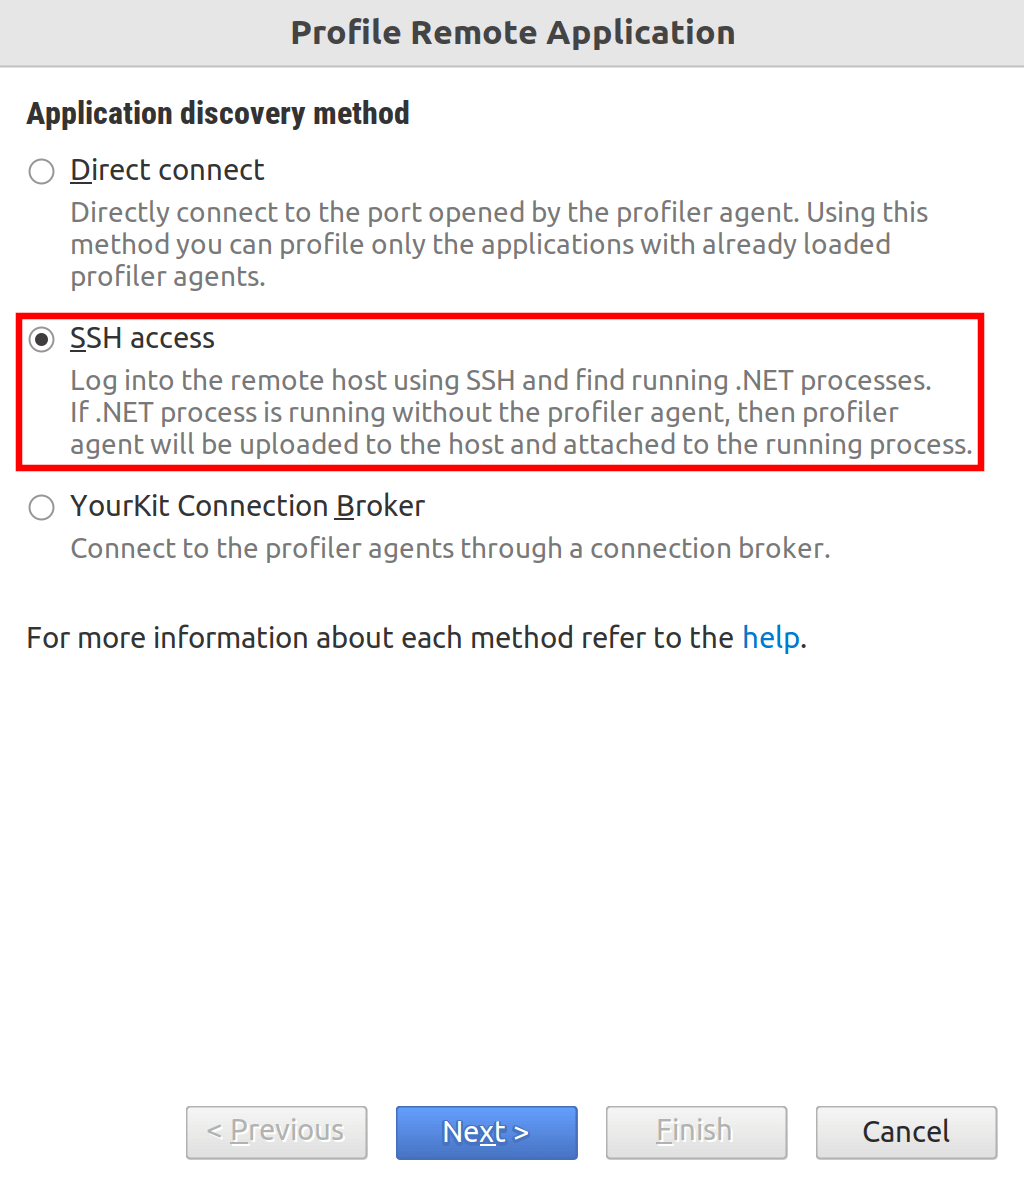
feature The profiler now utilizes SSH to log into remote machines, enabling it to discover all running .NET applications, including those running with or without the profiler agent. If required, the profiler has the capability to upload the agent to the remote machine and seamlessly attach it to your application for detailed profiling.
For authentication on the remote host, you can use plain password, SSH private key or SSH agent authentication methods.
- feature Introduced the ability to close (and later reopen) top tabs displaying profiling results when the profiler is connected to profiled applications.
- feature Added functionality to reset collected profiling results when profiling is disabled. Previously, resetting was only possible while profiling was active.
- improvement Double-clicking the drawer's button now toggles the collapse/expand state of the drawer.
-
improvement
Summary tab now shows user-friendly
.NET Framework version, similar to what
System.Runtime.InteropServices.RuntimeInformation.FrameworkDescriptionwould show. - caveat The Performance charts view has been renamed to Telemetry.
CPU profiling
- feature We have completely reimplemented the internals of our method tracer. Thanks to these changes, CPU tracing has become faster, more reliable, and it is now possible to trace CPU in attach mode. Previously, this functionality was available only with an agent loaded into the .NET runtime at the application's start.
- fix We have fixed several CIL (formerly MSIL) instrumentation errors that could lead to the crash of the profiled application.
Thread profiling
We have completely overhauled the user interface for thread profiling. It's now more convenient, clearer, and works much faster. We've tried to address all the UX shortcomings you pointed out when working with the old interface.
-
feature The thread list has been turned into a table with columns, which can show an unlimited number of threads.
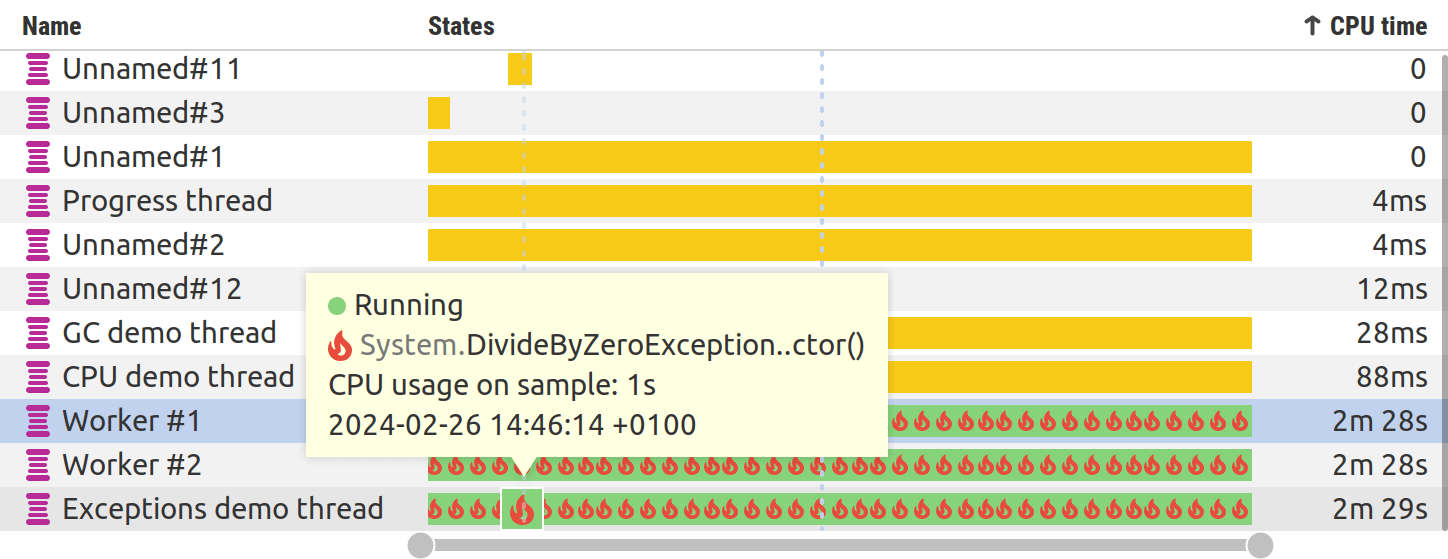
- feature You can sort threads by name and by consumed CPU time.
-
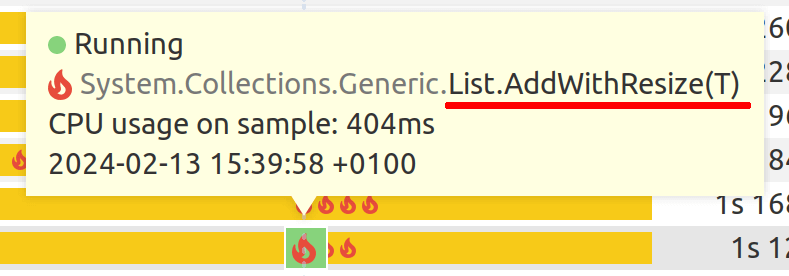
feature A tooltip appears upon mouse hover over individual thread activity bars, providing the name of the top method on the thread's stack.
-
feature
The ability to optionally display hot spots
 on the thread timeline has been added.
-
feature
Now it is possible to quickly change the range and scale of visible data
in the thread state timeline using the actions from the toolbar:
 ,
,
 ,
,

-
feature
You can control auto-scrolling behavior using the
 button in the toolbar.
When toggled, the timeline will be automatically scrolled to the right when new data arrives.
button in the toolbar.
When toggled, the timeline will be automatically scrolled to the right when new data arrives.
-
feature It is now possible to
zoom in and zoom out the thread state timeline by
Ctrl + Mouse wheelscrolling. -
feature You can control the amount of data collected (and accordingly, the profiler overhead) when starting thread profiling. You can do this through the UI, as well as with
threadsstartup option.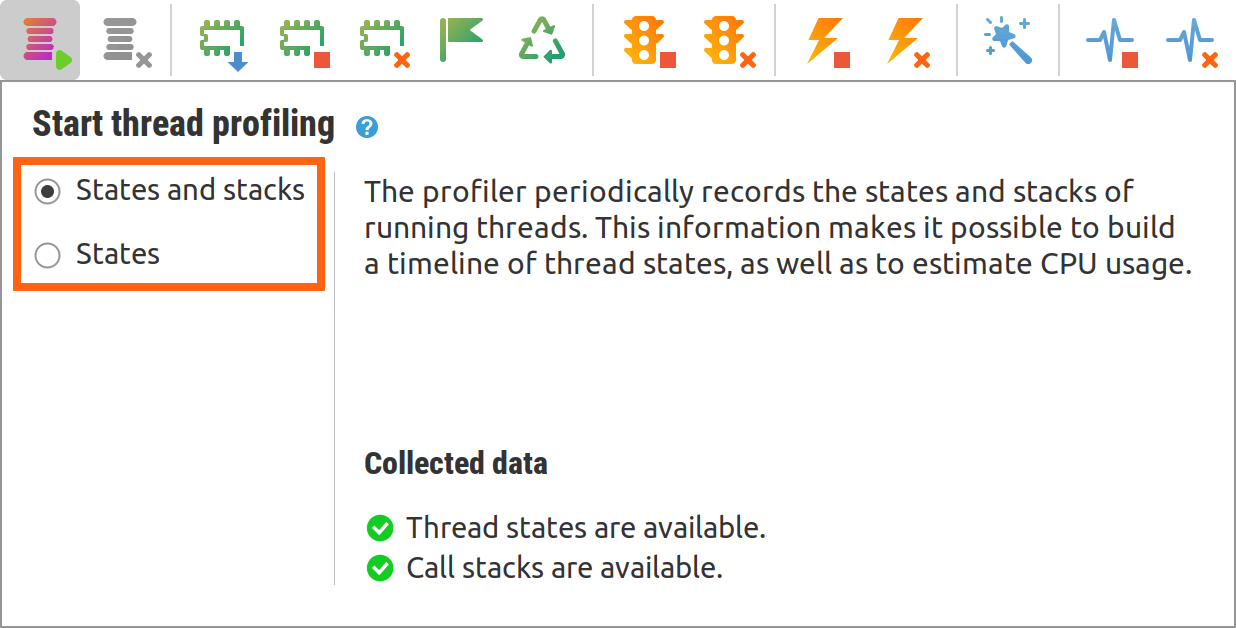
-
feature
You can now start
 ,
stop
,
stop
 ,
and reset
,
and reset
 thread profiling at any time.
- improvement Data collection for thread profiling has been separated from data collection for telemetry. Now you can reset telemetry data and thread profiling results independently.
- improvement The profiler better preserves fine details when changing the scale of the thread state timeline. In most cases, even very rare states will be visible even at the smallest scale.
Telemetry
-
feature
The user interface has been updated with toolbar buttons to start
 and stop
 telemetry collection, expanding control beyond the previous capability of
only clearing collected telemetry.
telemetry collection, expanding control beyond the previous capability of
only clearing collected telemetry.
Events
- feature It is now possible to record high-level events in attach mode. Previously, this functionality was available only with an agent loaded into the .NET runtime at the application's start.
IDE integration
- feature JetBrains Rider 2024.1 is supported.
Exception profiling
- feature Now you can profile exceptions in attach mode. In previous versions, this functionality was only available in the mode when the profiler agent was loaded into the .NET runtime at the application start.
Profiler API
-
feature
New
/ynp/api/v2/startTelemetryend-point to start telemetry collection. -
feature
New
/ynp/api/v2/stopTelemetryend-point to stop telemetry collection. -
feature
New
/ynp/api/v2/resetThreadProfilingend-point to reset thread profiling. -
feature
New methods in the profiler .NET API
startTelemetry(),stopTelemetry()andresetTelemetry()to control telemetry collection. -
improvement
The response of
getStatusrequest has been changed: flagstackTelemetryhas been replaced with flagthreadProfiling, flagtelemetryhas been added. -
improvement
The profiler HTTP API
has been updated to version v2.
We have added
resetmethods, which reset the profiling results and continue measurements. The HTTP API v1 is deprecated but continues to fully function. If you are using HTTP API v1, please make the corresponding changes. -
improvement
The
Resetmethods have been added to theYourKit.Profiler.Api.Controllerclass.
Triggers
-
feature
Added new actions
StartTelemetryandStopTelemetryto start and stop a telemetry collection, respectively. - fix The profiler might crash if the profiled application finishes during the editing of triggers.
-
caveat
Action
StartAllocationRecordingis replaced withStartAllocationProfiling. -
caveat
Action
StopAllocationRecordingis replaced withStopAllocationProfiling.
Miscellaneous
-
improvement
New
verboseoption to increase the level of detail in the agent's log file. - improvement We slightly changed the format of the agent's log file to make it clearer at what time events occur. Instead of uptime, wall time is now always recorded.
-
improvement
The command line interface
was simplified by replacing multiple scripts
(
attach.sh,integrate.sh,export.sh) with a singleprofiler.shscript that accepts parameters. For example, useprofiler.sh -integrateinstead ofintegrate.sh. This streamlines operations and improves usability. -
improvement
Unified naming convention for agent options:
Multi-word option names now utilize underscores for separation.
Example change: from
probetablelengthlimittoprobe_table_length_limit. Legacy options remain functional, but users are encouraged to update to the new format. -
caveat
The following obsolete agent startup options have been removed:
builtinprobes=all,builtinprobes=none,probe,noprobe,filters,samplingdelta,samplingperiod,onlylocal,do_advanced_port_check,skip_advanced_port_check,profileruipath,walltimespec
Deprecations
Deprecation means that we intend to remove the feature or capability from a future release of YourKit .NET Profiler. The feature or capability will continue to work and is fully supported until it is officially removed.
-
Trigger actions
StartAllocationRecordingandStopAllocationRecordingare deprecated and scheduled for removal. If you use these actions in the configuration files, please replace them withStartAllocationProfilingandStopAllocationProfilingaccordingly. -
Trigger actions
StartStackTelemetryandStopStackTelemetryare deprecated and scheduled for removal. If you use these actions in the configuration files, please replace them withStartThreadProfilingandStopThreadProfilingaccordingly. - The HTTP API v1 is deprecated and scheduled for removal. Please switch to HTTP API v2.
-
HTTP API end-point
/ynp/api/v1/startStackTelemetryhas been deprecated. Use/ynp/api/v2/startThreadProfiling. -
HTTP API end-point
/ynp/api/v1/stopStackTelemetryhas been deprecated. Use/ynp/api/v2/stopThreadProfiling. -
Agent startup option
disablestacktelemetryis deprecated in favor of new optionthreads=off. -
Export option
export.chartshas been deprecated. Useexport.telemetryto export the telemetry.